

How to Build a Scanning System 💯
You should have clear Steps to be followed when looking at a new Chart. No guess work.
Here is my System.
A Thread.
You should have clear Steps to be followed when looking at a new Chart. No guess work.
Here is my System.
A Thread.

Step 1. Select Time Frames
One Month Chart.
Investment for One Year+
Weekly Chart
Minimum 3 Month to 1 Year Positional trades.
Daily Chart
7 Days to 3 Months Short Term Positional.
Hourly Chart
Planning to Exit the Next day or within 7 Days.
30 Minutes
Exiting withing 24 Hours.
5 Minute Chart
Day Trade. Exiting the same day or Session.

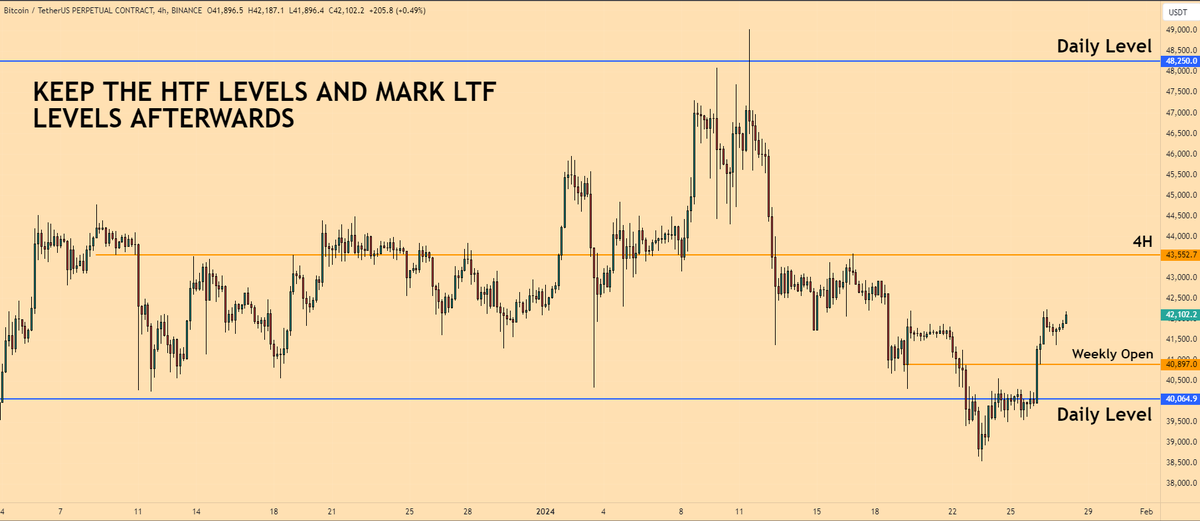
Step 2. Find Levels of Interest.
Timeframe to draw levels should be higher than Execution Timeframe.
Eg:
Want to trade the Hourly Chart.
Then Levels to be drawn on the 4H and Daily chart.
Study Price Action Levels Tutorial to find the right Levels.
bit.ly
Timeframe to draw levels should be higher than Execution Timeframe.
Eg:
Want to trade the Hourly Chart.
Then Levels to be drawn on the 4H and Daily chart.
Study Price Action Levels Tutorial to find the right Levels.
bit.ly

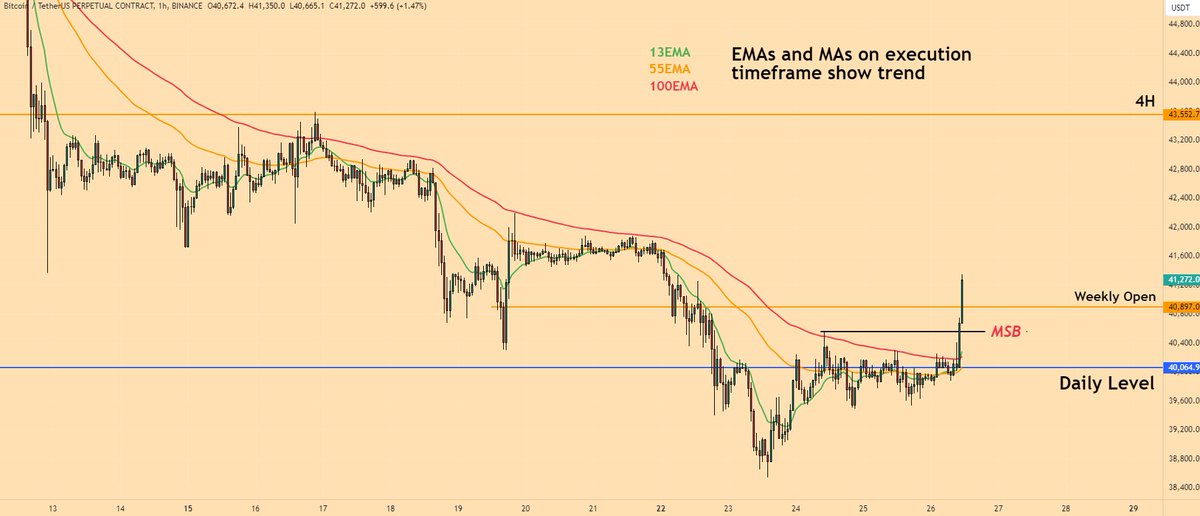
Step 3. Check for Trend And Market Structure.
Some examples:
1. Look for reversal at HTF Levels.
2. Reversal confirmation on lower/execution timeframe. So trade lower timeframe bullish trend and bullish market structure at HTF level of support.
EMAs to use and Market Structure Break shown on chart.
Key points: We are at HTF support + Price way below HTF EMAs (shows chance of reversal) + LTF bullish Market Structure Break (MSB) and LTF trend is flipped bullish.
Market Structure Tutorial: bit.ly
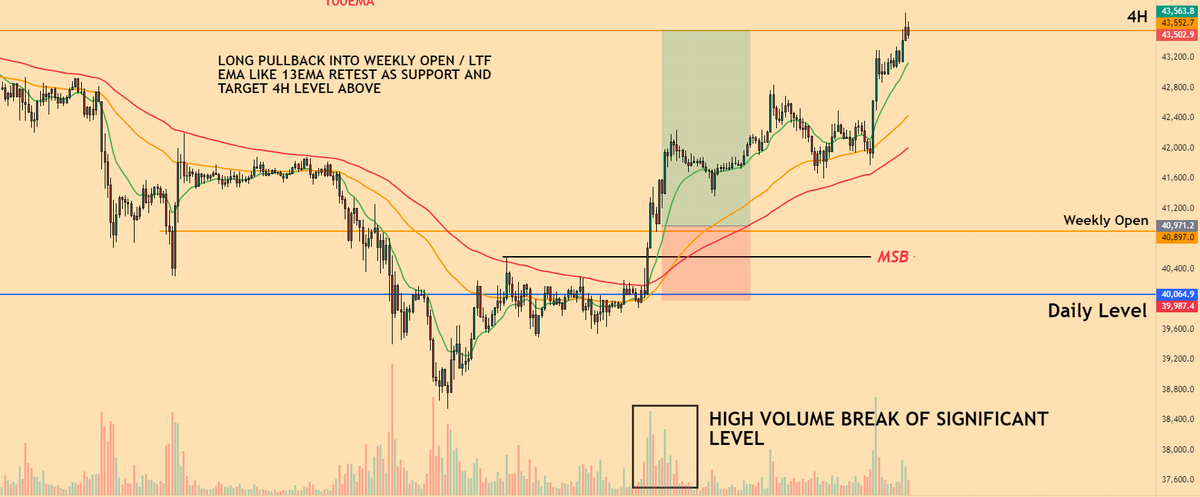
Step 4. Check for Volume Confirmation And Execute.
1. High volume move breakout/breakdowns show a strong move. Trend can continue in these cases.
2. High volume in a small range can show accumulation as well.
3. Losing point of breakout + losing 100EMA can be a stop loss level. EMA can be a trailing stop loss.
4. Entry can be taken in multiple orders from important level (Weekly Open) to the last high.
Execution shown in chart.
Beginner Volume Tutorial: shorturl.at
Summary - Set your TF. Find Trend. See if it's over extended or Oversold. Find your Levels.
This should happen in less than 1 Minute Per chart once you're Experienced.
Link to Learn Trading from Scratch -
t.me
This should happen in less than 1 Minute Per chart once you're Experienced.
Link to Learn Trading from Scratch -
t.me


جاري تحميل الاقتراحات...