

Following the cycles, this bull run should last for another 1.5 year.
Mastering the indicators can be ur key to 100x on ur portfolio, but only few know how to use them correctly.
Here’s my mega-thread: 15 best indicators & how to use them to win in crypto 👇🏽
Mastering the indicators can be ur key to 100x on ur portfolio, but only few know how to use them correctly.
Here’s my mega-thread: 15 best indicators & how to use them to win in crypto 👇🏽

Before I begin, I have a favor to ask...
I spent a lot of time writing this thread, trying to make it genuinely useful for you, so if it's not too much trouble, please bookmark it, retweet, leave a comment, or simply hit like 🤍
I spent a lot of time writing this thread, trying to make it genuinely useful for you, so if it's not too much trouble, please bookmark it, retweet, leave a comment, or simply hit like 🤍
➮ In this thread, we will analyze the 15 best indicators that will help you succeed in crypto
Indicators are divided into the following types:
- Trend indicators
- Momentum indicators
- Volume indicators
Now let's dive into the best indicators from each type👇
Indicators are divided into the following types:
- Trend indicators
- Momentum indicators
- Volume indicators
Now let's dive into the best indicators from each type👇
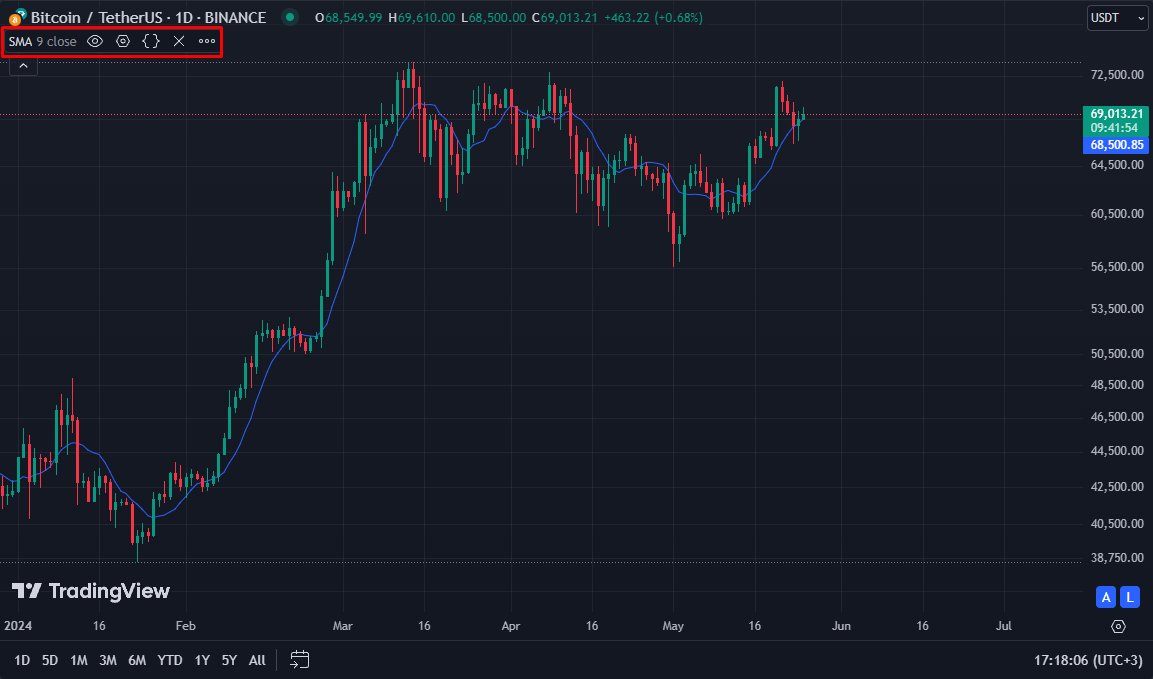
1/➮ Moving Average (MA)
✧ The Moving Average indicator calculates the average price over a set number of candles, smoothing price action by filtering out short-term fluctuations
✧ The Moving Average indicator calculates the average price over a set number of candles, smoothing price action by filtering out short-term fluctuations
Disclaimer:
I'll likely make my X and TG private soon, so make sure to follow me here and join my tg (link in bio), so u won't miss this and my future threads.
I'll likely make my X and TG private soon, so make sure to follow me here and join my tg (link in bio), so u won't miss this and my future threads.
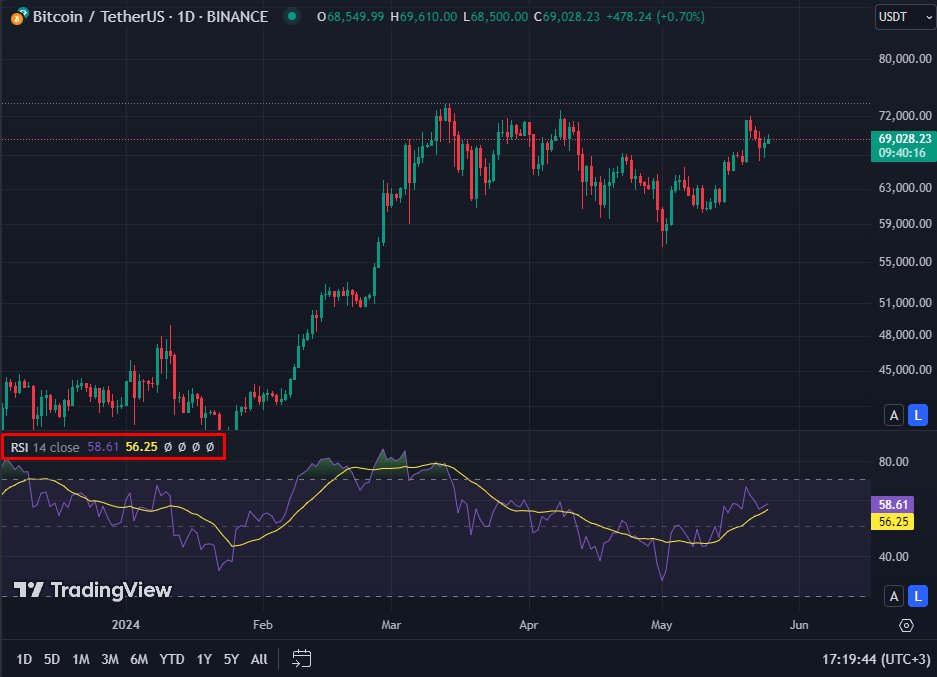
2/➮ Relative Strength Index (RSI)
✧ The RSI, a momentum indicator, measures price changes over 14 days, ranging from 0 to 100
✧ 70< = overbought conditions, likely indicating a price drop, while <30 suggests oversold, hinting at pump
✧ The RSI, a momentum indicator, measures price changes over 14 days, ranging from 0 to 100
✧ 70< = overbought conditions, likely indicating a price drop, while <30 suggests oversold, hinting at pump
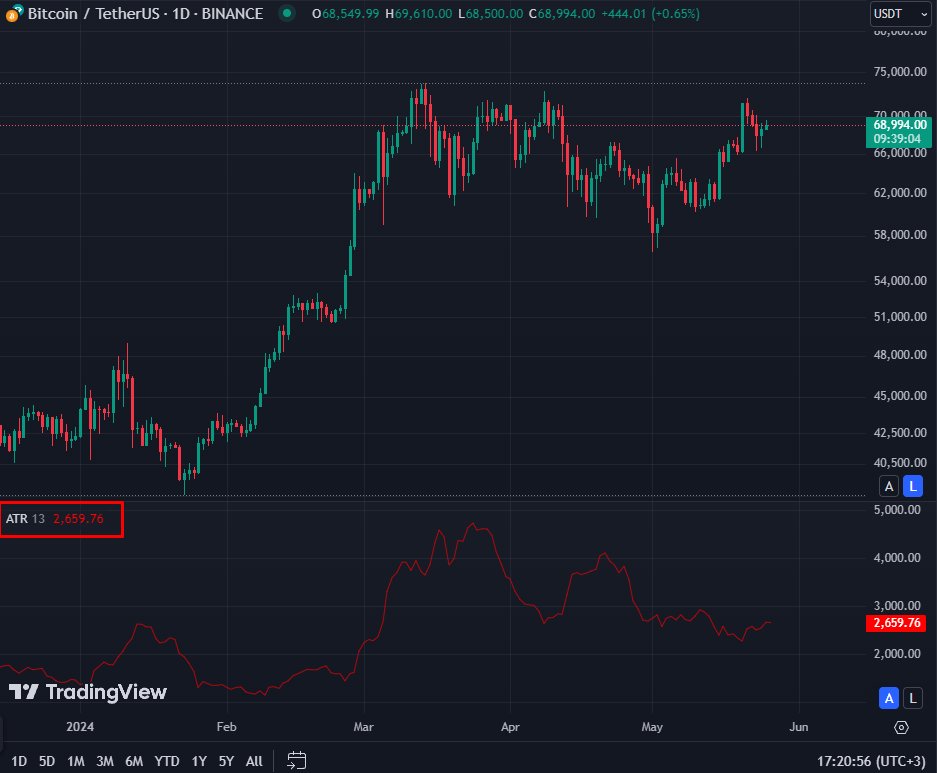
3/➮ Average True Range (ATR)
✧ Measures volatility by calculating an asset's range over a period, typically 14 days
✧ In crypto, it helps set stop-losses: a high ATR means more volatility and wider stop-losses; a low ATR suggests less volatility and tighter stop-losses
✧ Measures volatility by calculating an asset's range over a period, typically 14 days
✧ In crypto, it helps set stop-losses: a high ATR means more volatility and wider stop-losses; a low ATR suggests less volatility and tighter stop-losses
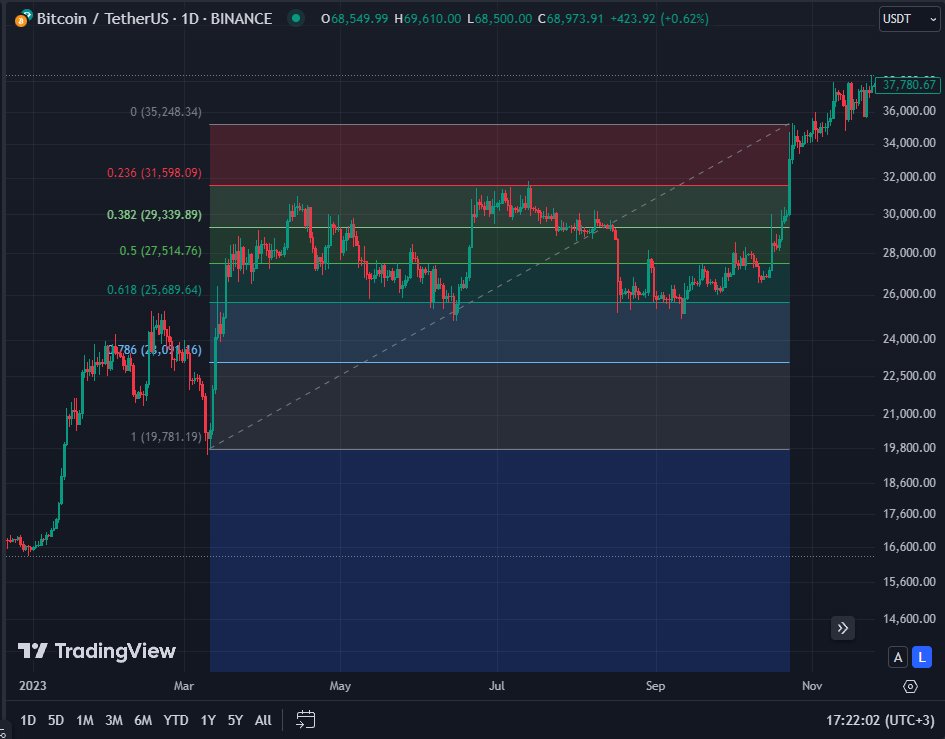
4/➮ Fibonacci Retracement
✧ Fibonacci retracement levels—38.2%, 50%, and 61.8%—stem from the Golden Ratio
✧ They indicate potential support & resistance levels, might rebound or reverse in a trend
✧ Detailed guide:
x.com
✧ Fibonacci retracement levels—38.2%, 50%, and 61.8%—stem from the Golden Ratio
✧ They indicate potential support & resistance levels, might rebound or reverse in a trend
✧ Detailed guide:
x.com
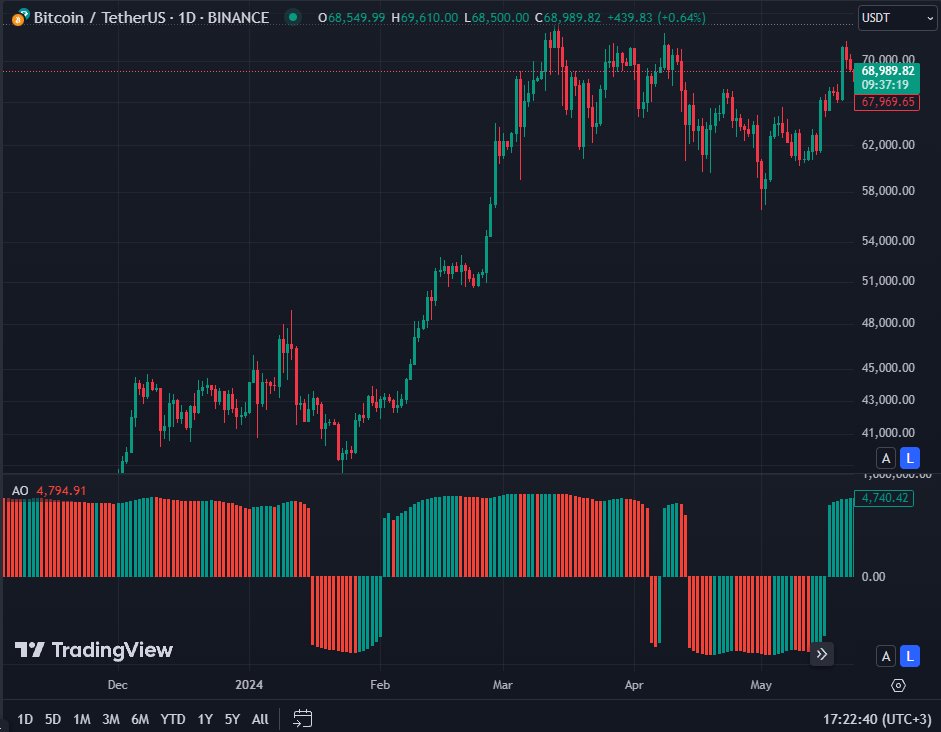
5/➮ Awesome Oscillator
✧ The Awesome Oscillator measures market momentum using the difference between the 34 and 5-period simple moving averages, calculated from the midpoint of the bar, not the opening or closing prices.
✧ The Awesome Oscillator measures market momentum using the difference between the 34 and 5-period simple moving averages, calculated from the midpoint of the bar, not the opening or closing prices.
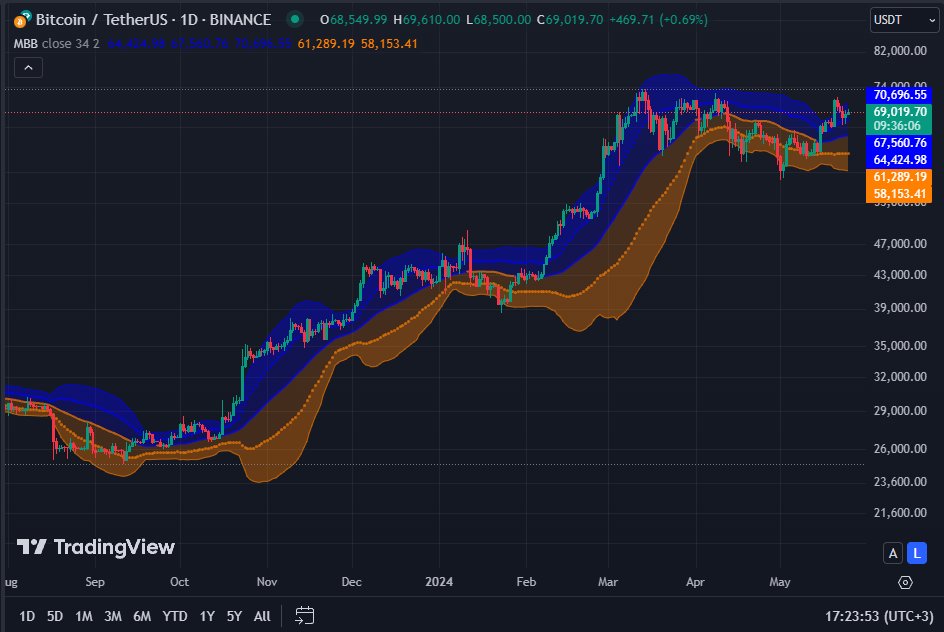
6/➮ Bollinger Bands
✧ Consist of a central ma with upper/lower bands showing volatility
✧ Narrow bands indicate low volatility, while wider ones suggest high volatility
✧ Traders use them to identify overbought or oversold conditions and predict major price moves
✧ Consist of a central ma with upper/lower bands showing volatility
✧ Narrow bands indicate low volatility, while wider ones suggest high volatility
✧ Traders use them to identify overbought or oversold conditions and predict major price moves
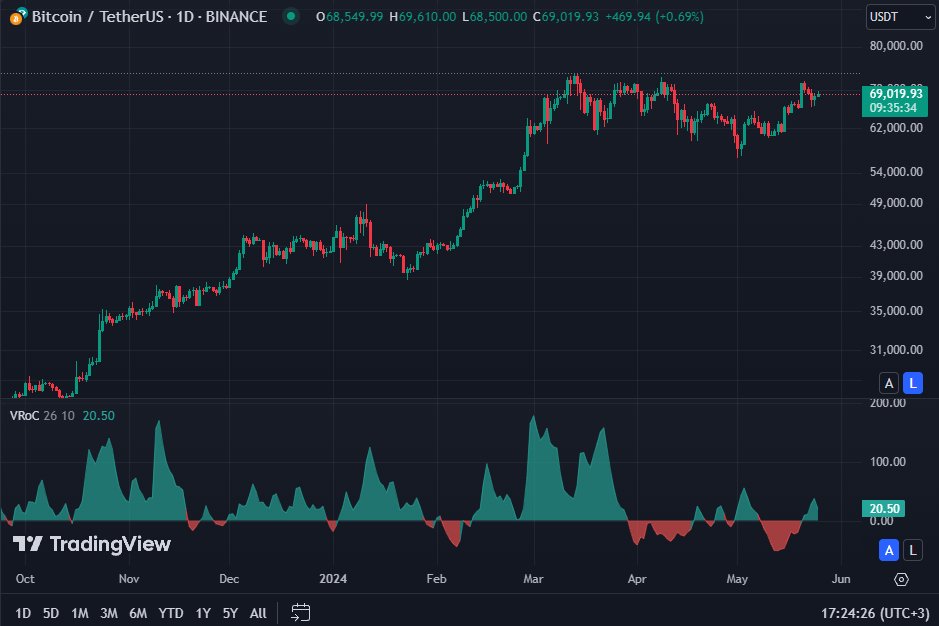
7/➮ Volume Rate of Change (VROC)
✧ Tracks rapid changes in volume to identify breakouts & confirm trends
✧ Sharp volume increase without price change often predicts major price movements
✧ Rising VROC with price suggests bullish trends
✧ Tracks rapid changes in volume to identify breakouts & confirm trends
✧ Sharp volume increase without price change often predicts major price movements
✧ Rising VROC with price suggests bullish trends
8/➮ Stochastic Oscillator
✧ The Stochastic Oscillator ranges from 0 to 100, measuring price momentum
✧ In crypto, a rise above 80 followed by a drop signals a sell, while dipping below 20 and then rising hints at a buy, useful for spotting market reversals.
✧ The Stochastic Oscillator ranges from 0 to 100, measuring price momentum
✧ In crypto, a rise above 80 followed by a drop signals a sell, while dipping below 20 and then rising hints at a buy, useful for spotting market reversals.

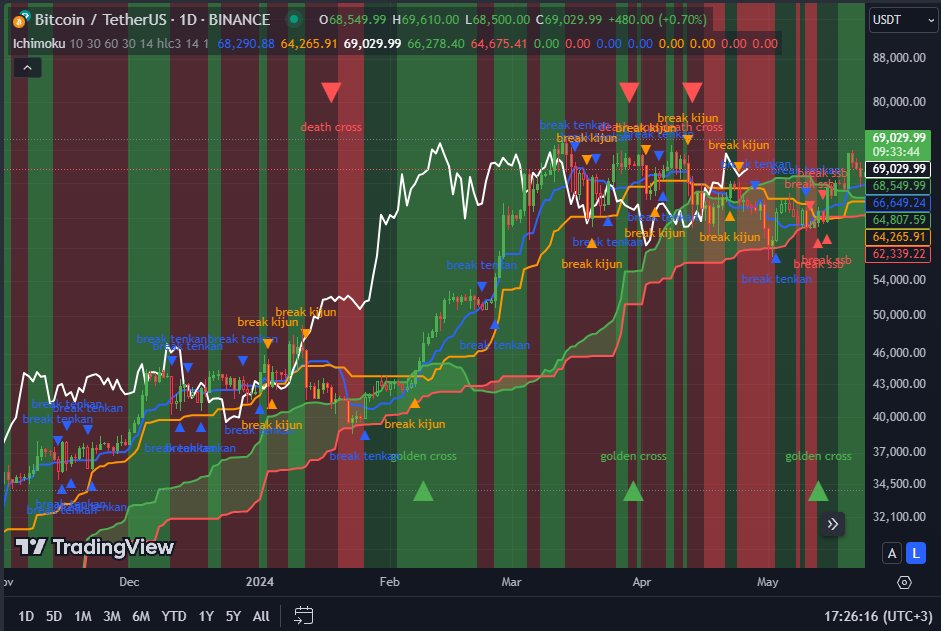
9/➮ Ichimoku Kinko Hyo
✧ The Ichimoku Indicator combines moving averages to form a cloud that predicts future support and resistance levels
✧ Unlike conventional averages that use closing values, Ichimoku calculates using midpoints of each period.
✧ The Ichimoku Indicator combines moving averages to form a cloud that predicts future support and resistance levels
✧ Unlike conventional averages that use closing values, Ichimoku calculates using midpoints of each period.
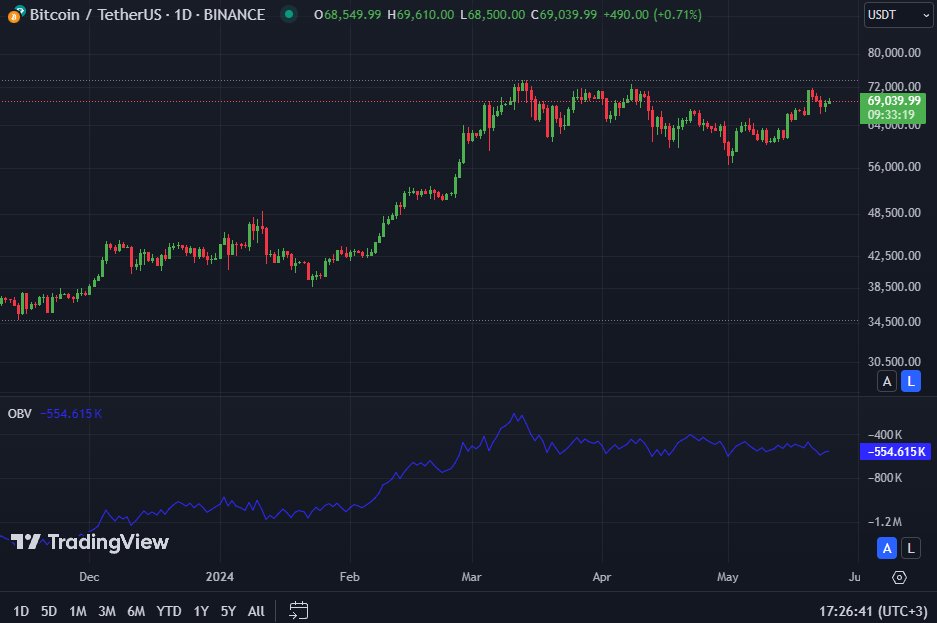
10/➮ On Balance Volume (OBV)
✧ OBV in crypto aggregates buy/sell volumes to forecast price trends and gauge market sentiment
✧ A rising OBV suggests increased buying and potential uptrends; a falling OBV signals rising selling pressure and likely downtrends
✧ Discrepancies between price trends and OBV can indicate weak trend support
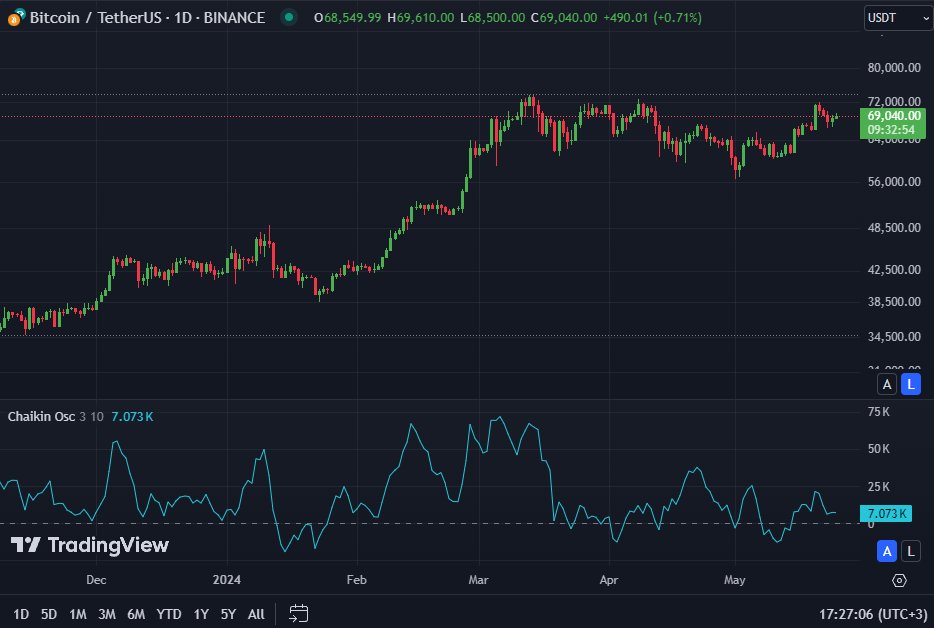
11/➮ Chaikin Oscillator (CHO)
✧ Measures momentum by subtracting a 10-day EMA from a 3-day EMA of the accumulation-distribution line, reflecting oscillations around it
✧ A positive reading suggests net buying pressure, while a negative indicates selling pressure
✧ Measures momentum by subtracting a 10-day EMA from a 3-day EMA of the accumulation-distribution line, reflecting oscillations around it
✧ A positive reading suggests net buying pressure, while a negative indicates selling pressure
12/➮ Average Directional Index (ADX)
✧ The ADX is a momentum indicator that measures the strength of a price trend, including in cryptocurrencies
✧ It suggests trading in strong trends to increase profit chances and reduce risks
✧ The ADX is a momentum indicator that measures the strength of a price trend, including in cryptocurrencies
✧ It suggests trading in strong trends to increase profit chances and reduce risks

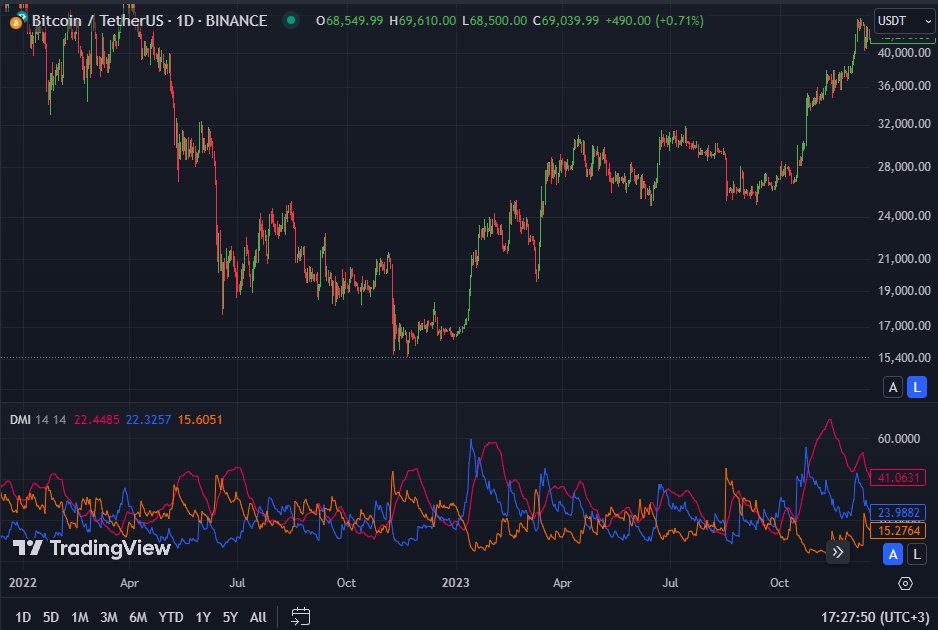
13/➮ Directional Movement Index (DMI)
✧ Directional Movement (DMI) combines three indicators: ADX measures trend presence, +DI and -DI gauge trend direction
✧ Together, they assess a trend’s strength and direction, aiding technical analysis
✧ Directional Movement (DMI) combines three indicators: ADX measures trend presence, +DI and -DI gauge trend direction
✧ Together, they assess a trend’s strength and direction, aiding technical analysis
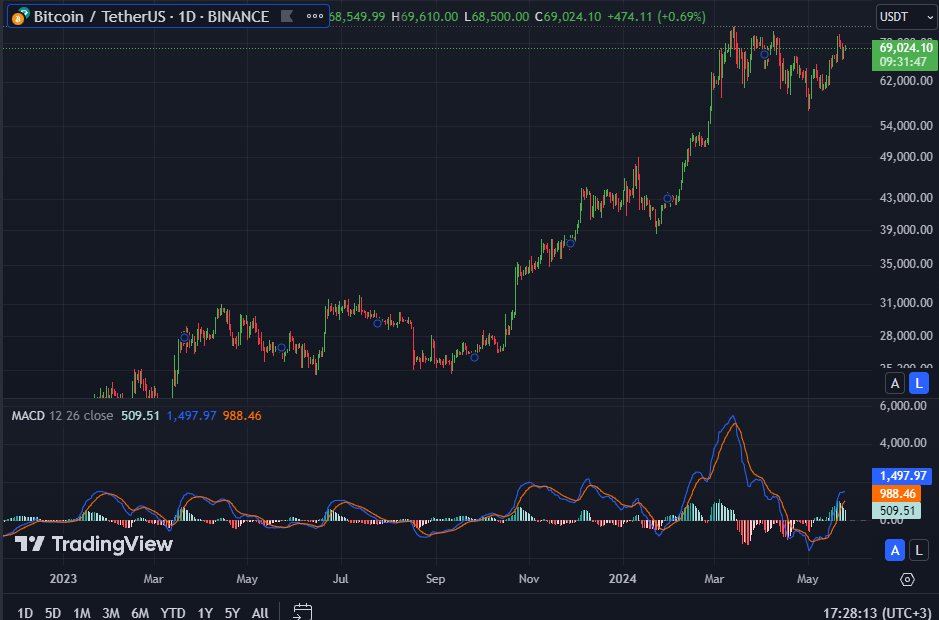
14/➮ Moving Average Convergence Divergence (MACD)
✧ The MACD in crypto displays the relationship between two EMAs, including the MACD line, signal line, and histogram
✧ Crossovers above the signal line suggest bullish trends and buy signals, while below signal bearish trends and sell opportunities
✧ The gap between the lines indicates trend strength
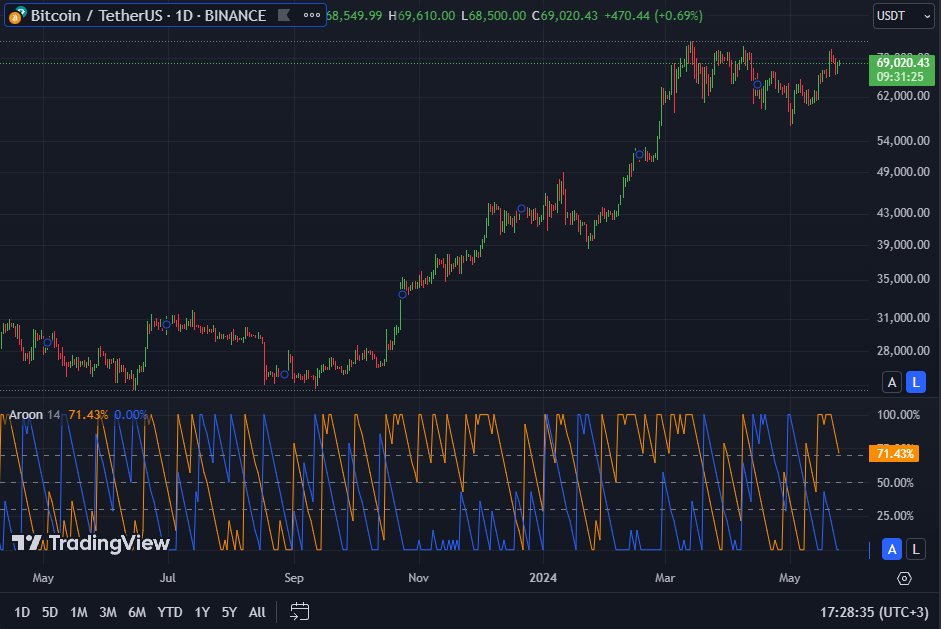
15/➮ Aroon Indicator
✧ The Aroon indicator identifies trend changes and strength by measuring the time between highs and lows
✧ It includes the "Aroon up" line for uptrend strength and "Aroon down" for downtrend strength, signaling when new highs or lows occur
✧ The Aroon indicator identifies trend changes and strength by measuring the time between highs and lows
✧ It includes the "Aroon up" line for uptrend strength and "Aroon down" for downtrend strength, signaling when new highs or lows occur
And finally, I want to add:
- Indicators are not a cure-all, and I use them only to find better entry, but definitely not to determine which asset to buy.
- Don't use 10 indicators at once; it will only create noise on the chart. Find 2-4 that work for you and stick with them.
- Indicators are not a cure-all, and I use them only to find better entry, but definitely not to determine which asset to buy.
- Don't use 10 indicators at once; it will only create noise on the chart. Find 2-4 that work for you and stick with them.
I've created a Free Discord Server where u can find everything u've been missing in crypto:
✧ Community & mentorship
✧ Free airdrop software
✧ Shitcoin & NFT calls
✧ Daily news and airdrop to-do list
✧ Giveaways & WL raffles
Join for free
✧ Community & mentorship
✧ Free airdrop software
✧ Shitcoin & NFT calls
✧ Daily news and airdrop to-do list
✧ Giveaways & WL raffles
Join for free
➮ My TG channel has become too large to drop lowcaps and other moves with a small number of users, so I'll make it private very soon. Now is likely ur last chance to join:
t.me
t.me


➮ Liked this thread? I write educational threads daily, so don't forget to:
✧ Follow me @nobrainflip
✧ Join my tg t.me
✧ Like, RT, bookmark and leave a comment on the first tweet 👇
x.com
✧ Follow me @nobrainflip
✧ Join my tg t.me
✧ Like, RT, bookmark and leave a comment on the first tweet 👇
x.com
جاري تحميل الاقتراحات...