

Gemini is just amazing for creating charts.
You can search for reliable data and visualize it easily.
Here's how to generate and even modify charts using Gemini (even with the free version) 🧵
You can search for reliable data and visualize it easily.
Here's how to generate and even modify charts using Gemini (even with the free version) 🧵
1. Search and find data
- Open Gemini (free version or Advanced if you have it):
gemini .google. com
- Enter the prompt below to find and structure data
As Gemini is connected in real time to the Internet, it will give you up-to-date data and links to access it.
- Open Gemini (free version or Advanced if you have it):
gemini .google. com
- Enter the prompt below to find and structure data
As Gemini is connected in real time to the Internet, it will give you up-to-date data and links to access it.

Prompt example:
"Search and create a comprehensive table detailing the market shares of major search engines over the past decade (with one line per year and one column per search engine).
Ensure the table is clear, concise, and capable of being interpreted at a glance. Also give the link to the sources you used."
"Search and create a comprehensive table detailing the market shares of major search engines over the past decade (with one line per year and one column per search engine).
Ensure the table is clear, concise, and capable of being interpreted at a glance. Also give the link to the sources you used."
2. Check sources
- At the bottom of the table Gemini will give you the sources used
- Click on the links to double-check their reliability
This is obviously an essential step, especially if the chart you want to create has a professional or academic purpose.
- At the bottom of the table Gemini will give you the sources used
- Click on the links to double-check their reliability
This is obviously an essential step, especially if the chart you want to create has a professional or academic purpose.

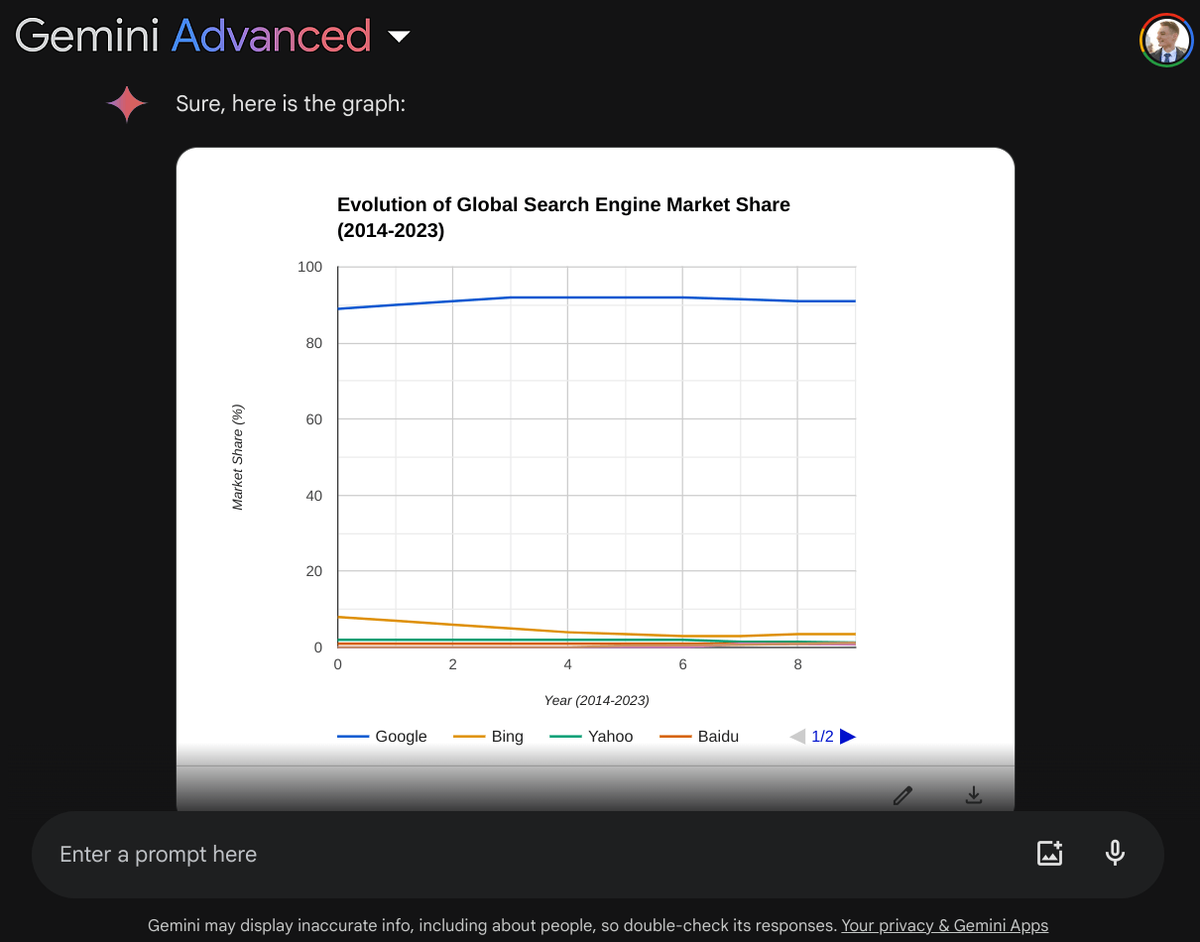
3. Generate the chart
- Gemini can create your chart in a single prompt
- You can modify it later, even if you want to change the type
Prompt:
"Using the data from the previous table, create a bar chart to visualize the evolution of market shares over the years."
- Gemini can create your chart in a single prompt
- You can modify it later, even if you want to change the type
Prompt:
"Using the data from the previous table, create a bar chart to visualize the evolution of market shares over the years."

4. Edit the chart
- Click on the bottom right of the chart
- Select "Customize" to access all options
- You can now modify the title, axis names and chart type.
Now all that's left to do is to download the chart using the download icon.
- Click on the bottom right of the chart
- Select "Customize" to access all options
- You can now modify the title, axis names and chart type.
Now all that's left to do is to download the chart using the download icon.

Now you know all about finding and visualizing data with Gemini!
It's great for light data analysis, or your first market analysis, for example.
Don't hesitate to like the 1st post of the thread to share my work if you found it useful!
It's great for light data analysis, or your first market analysis, for example.
Don't hesitate to like the 1st post of the thread to share my work if you found it useful!
جاري تحميل الاقتراحات...