

🧵 • Economic calendar & the weekly range.
The economic calendar CAN frame out the weekly range however, without daily candle closes using solely the economic calendar is use less.
The economic calendar CAN frame out the weekly range however, without daily candle closes using solely the economic calendar is use less.

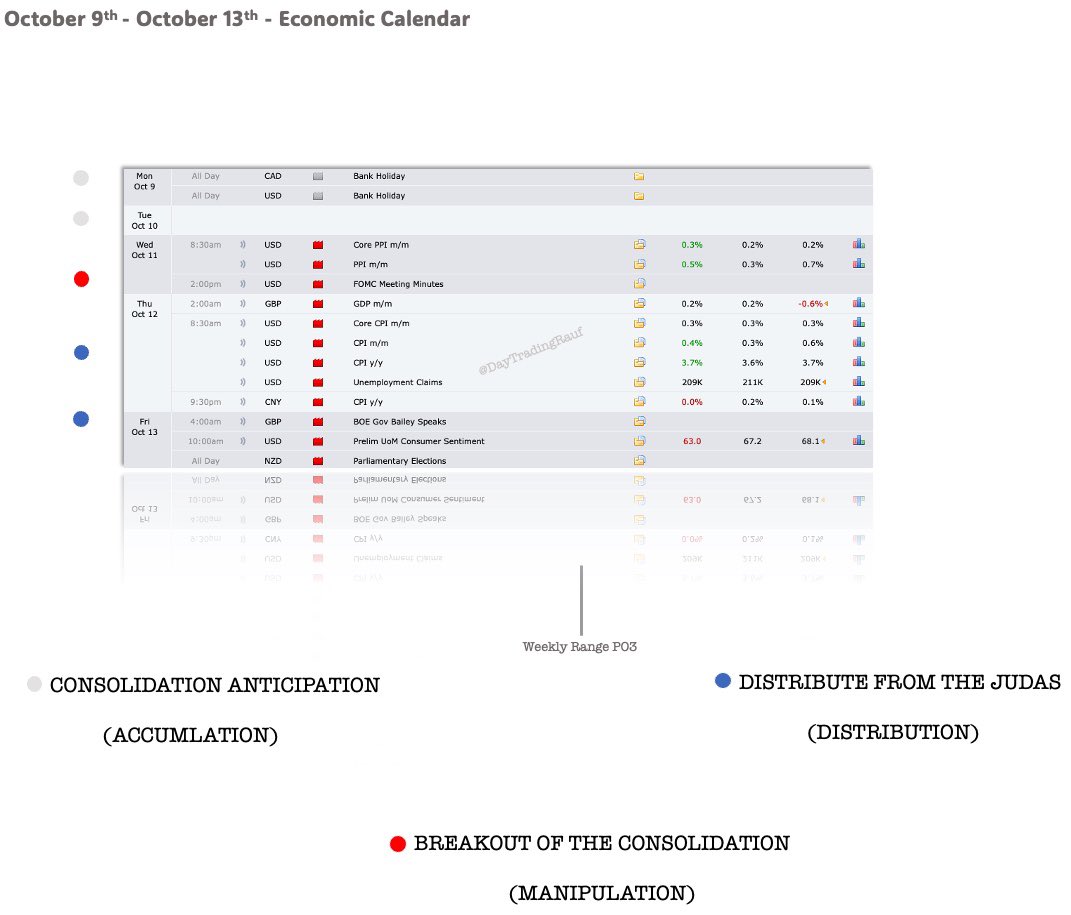
Firstly look at the calendar for the weekly range here is an example, you can map out the days you expect a consolidation, manipulation & distribution.
However this is what you expect it won’t happen like this, this is where the study of daily close candles can support / invalidate your bias.
However this is what you expect it won’t happen like this, this is where the study of daily close candles can support / invalidate your bias.
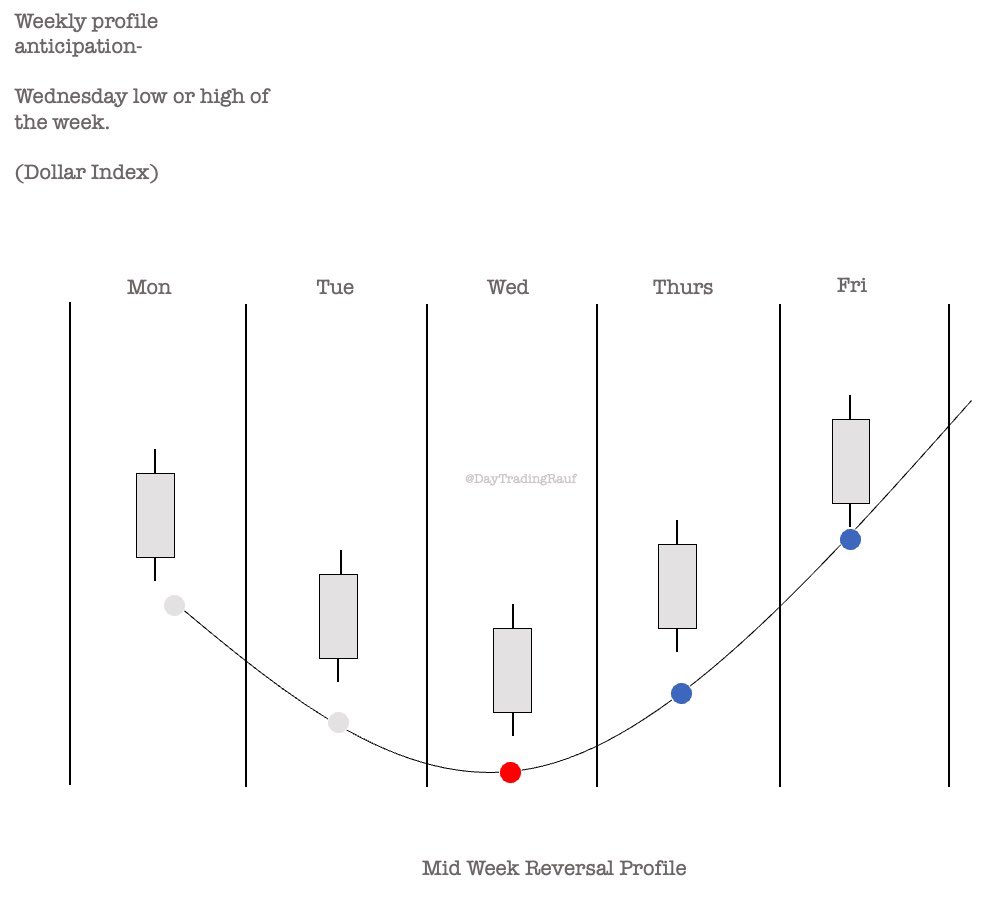
As we expect Wednesday to be the manipulation from the example above we can look at weekly profiles to support what we are looking at.
Midweek reversal profile (anticipation)
Midweek reversal profile (anticipation)
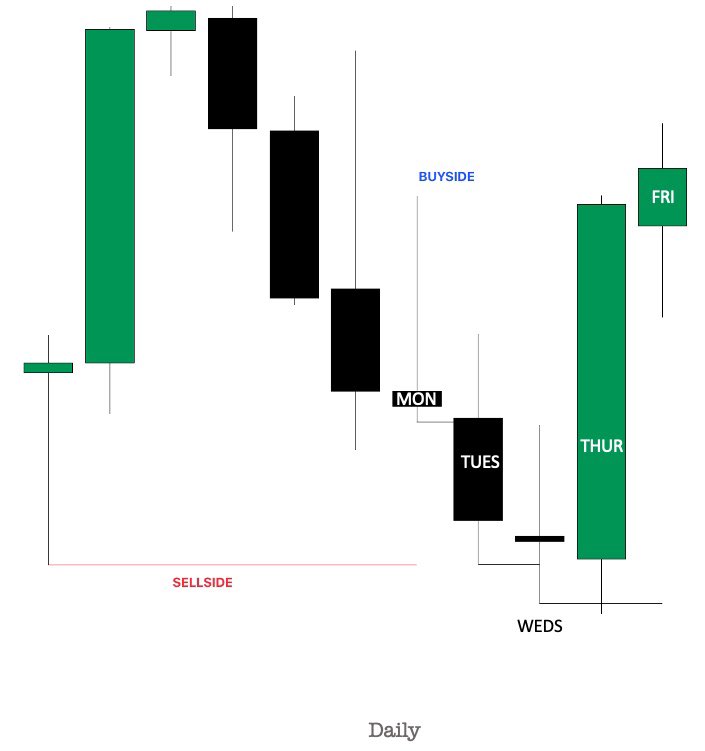
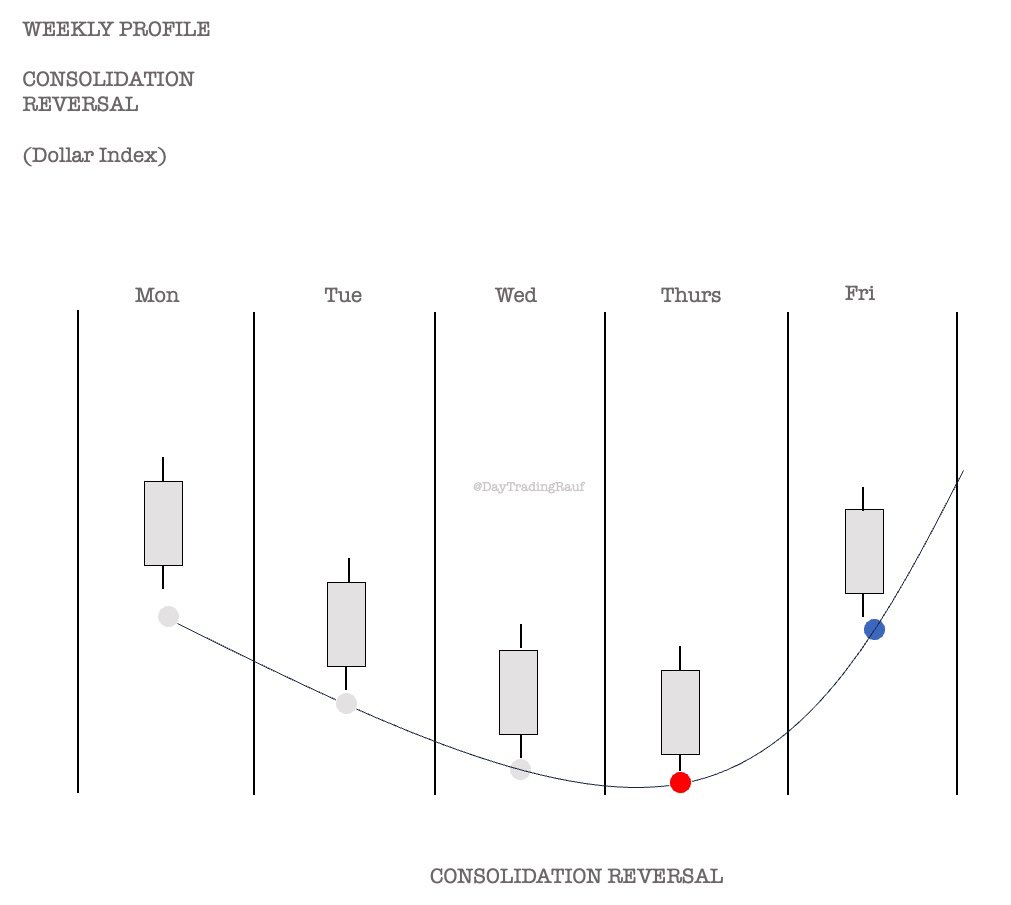
Now this is how the trading week played out compared to the anticipation:
We got the manipulation on Thursday which was a reversal we were looking for however, if you looked at the daily candles along side your bias for the mid week reversal, you would of seen the three drive reversal to support your frame work for the next day.
We got the manipulation on Thursday which was a reversal we were looking for however, if you looked at the daily candles along side your bias for the mid week reversal, you would of seen the three drive reversal to support your frame work for the next day.
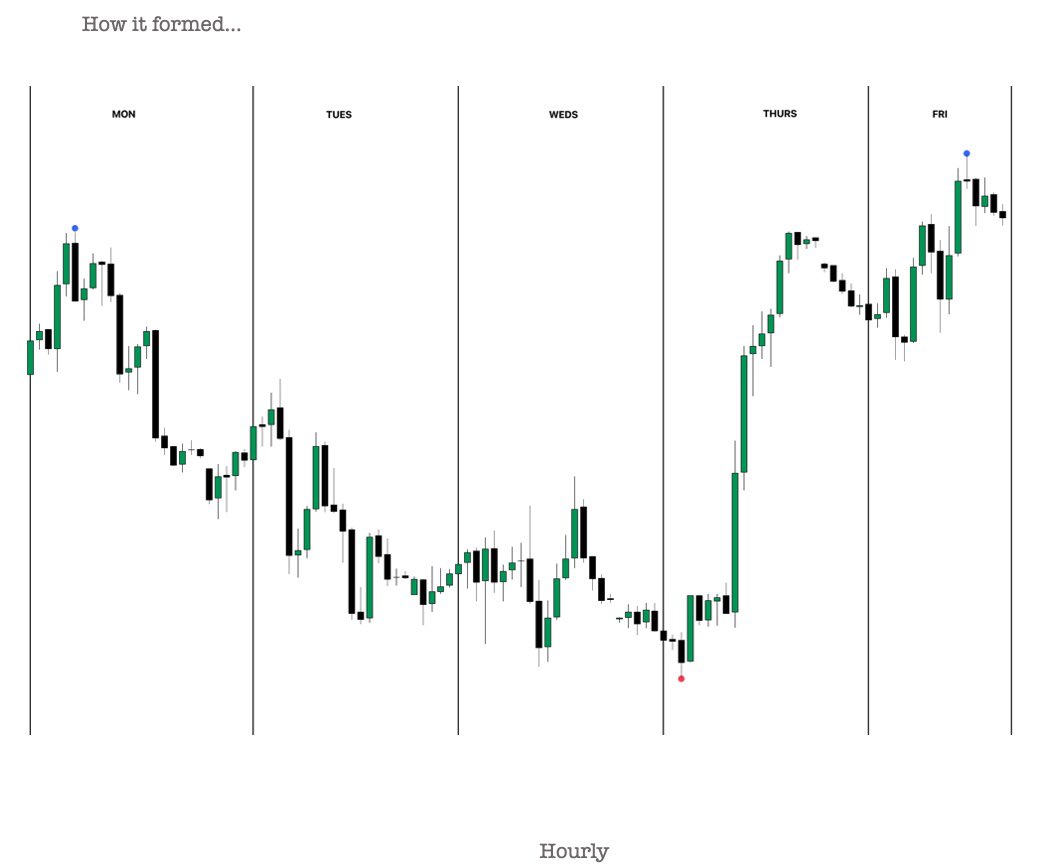
This is how you should be interpreting the economic calendar news events along side price action as it is - TIME & PRICE.
look at the calendar frame out the weekly range anticipate days where manipulation is going to occur and then use daily candle closes to support the frame work.
When all of this comes together the daily candles closes matching with the economic calendar new events this is where you can frame out the high probability trading days.
Previous thread on using it as your road map.
Hope this thread helped I tried to condense a lot of information into a short thread, I can always touch up on this topic with a YouTube video.
🤜🤛
🤜🤛
جاري تحميل الاقتراحات...