

1/n
RSI, developed in 1978, is still the most widely used indicator.
There’s a reason that it has remained AGELESS.
Let’s explore the secrets.
A 🧵
#NIFTYFUTURE #banknifty #stockmarketcrash
RSI, developed in 1978, is still the most widely used indicator.
There’s a reason that it has remained AGELESS.
Let’s explore the secrets.
A 🧵
#NIFTYFUTURE #banknifty #stockmarketcrash

2/n
In this thread, we will see
1.Significance of RSI
2.RSI divergence
3.RSI in strong trends
4.RSI near support/resistance
5.RSI trendline breakouts
Some golden Nuggets at the end of thread
In this thread, we will see
1.Significance of RSI
2.RSI divergence
3.RSI in strong trends
4.RSI near support/resistance
5.RSI trendline breakouts
Some golden Nuggets at the end of thread
3/n
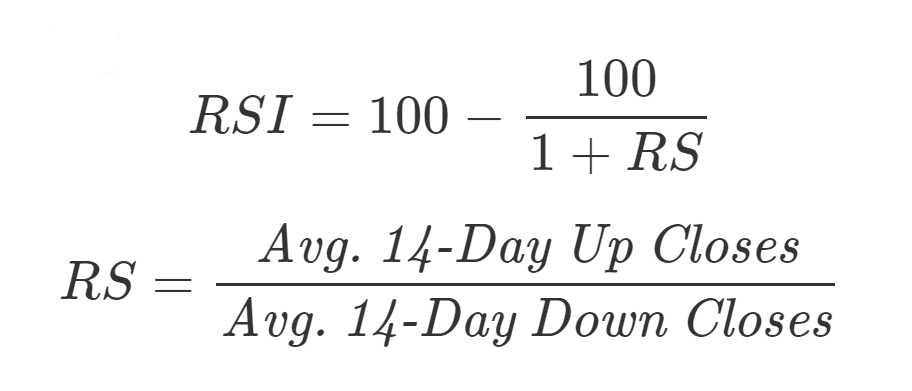
Significance of RSI:
It signifies that for a period of n days, if a stock fell, what was the intensity of fall
And if the stock rose, what was the intensity of rise
Mostly n=14 is used but it can be changed and used at any time frame
Significance of RSI:
It signifies that for a period of n days, if a stock fell, what was the intensity of fall
And if the stock rose, what was the intensity of rise
Mostly n=14 is used but it can be changed and used at any time frame
4/n
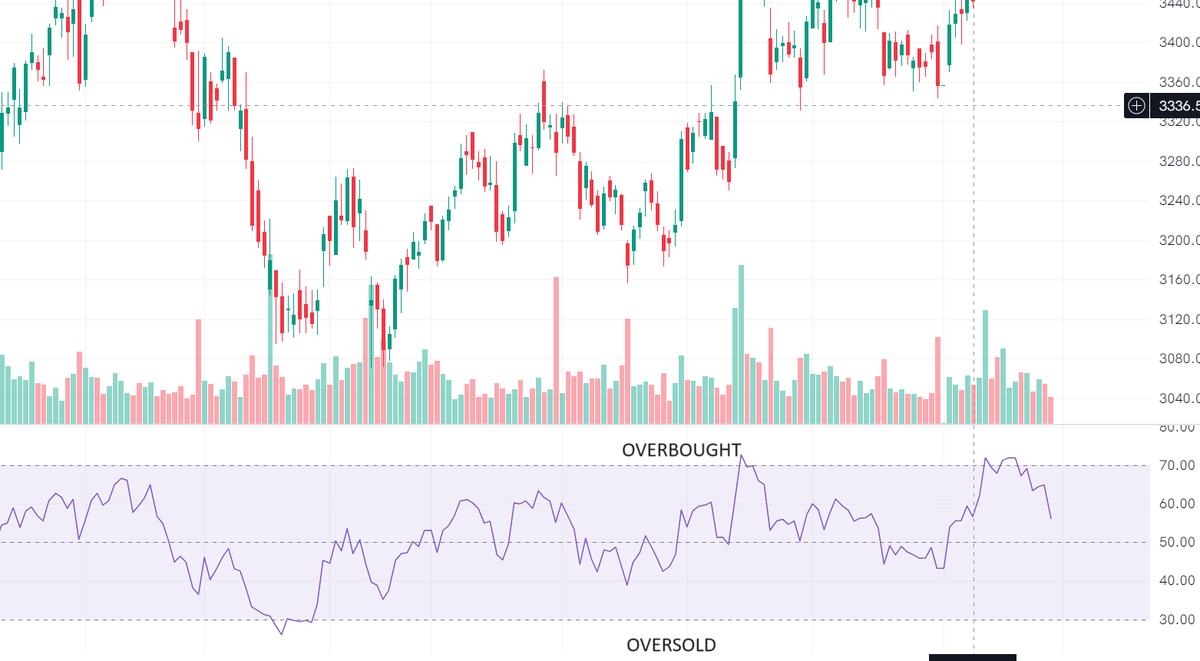
It measures the speed and change of price movements.
RSI oscillates between 0 and 100.
Above 70 overbought and below 30 oversold
It measures the speed and change of price movements.
RSI oscillates between 0 and 100.
Above 70 overbought and below 30 oversold
5/n
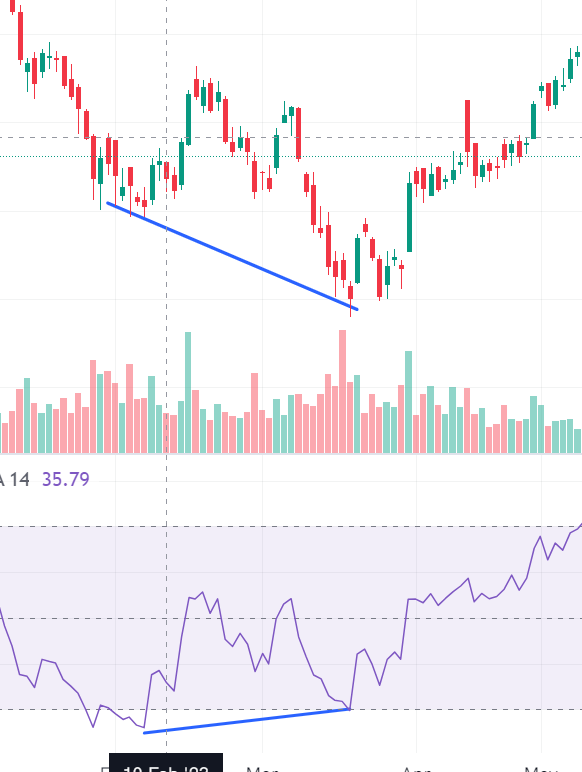
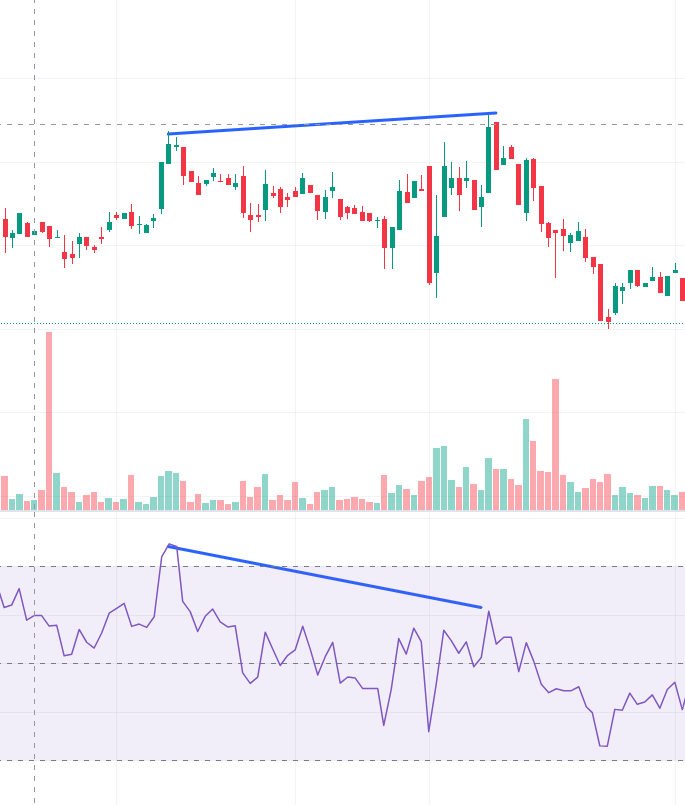
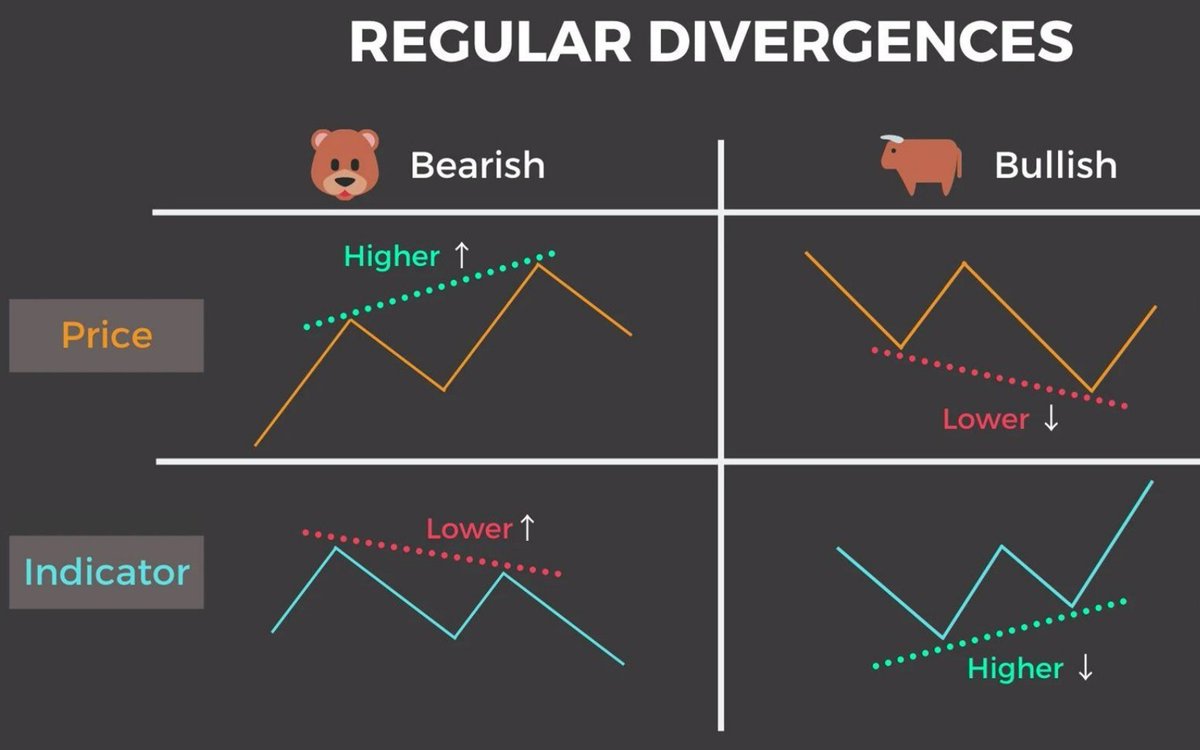
RSI divergence:
The most potent tool of RSI is RSI divergence
RSI Divergence occurs when the Relative Strength Index indicator starts reversing before price does.
RSI divergence:
The most potent tool of RSI is RSI divergence
RSI Divergence occurs when the Relative Strength Index indicator starts reversing before price does.
6/n
RSI divergence indicates when a trend is fading giving early signal for entry/exit.
There are two types of divergence - Bullish and Bearish divergence
Image: @TheBirbNest
RSI divergence indicates when a trend is fading giving early signal for entry/exit.
There are two types of divergence - Bullish and Bearish divergence
Image: @TheBirbNest
7/n
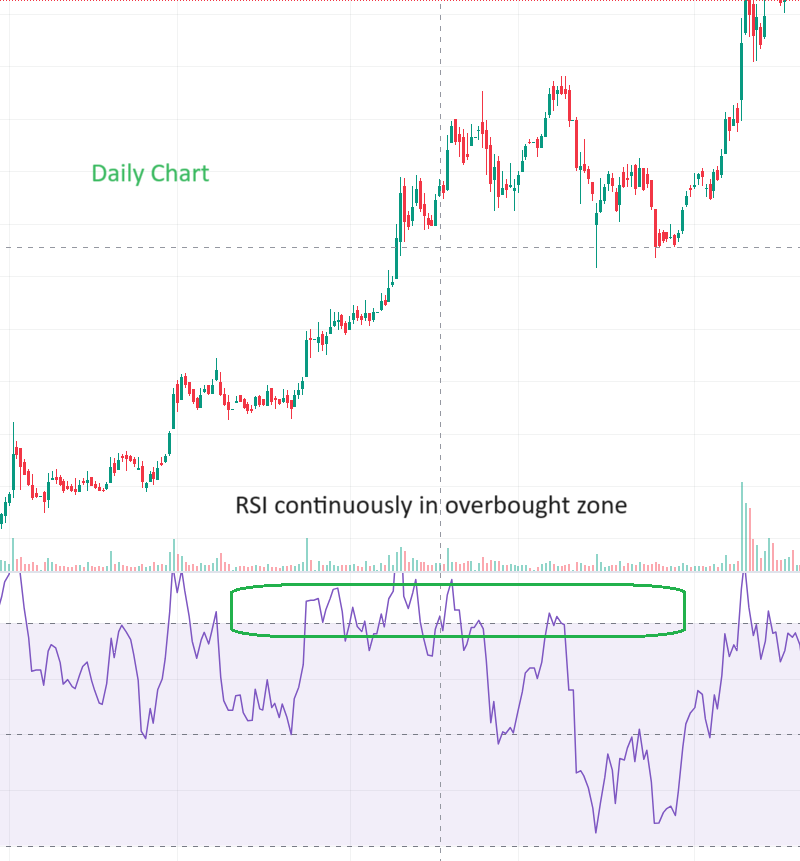
RSI in strong trends:
The RSI can remain overbought zone in a strong trend due to continuous buying interest.
A multi-TF analysis can help us decipher this
RSI in strong trends:
The RSI can remain overbought zone in a strong trend due to continuous buying interest.
A multi-TF analysis can help us decipher this
8/n
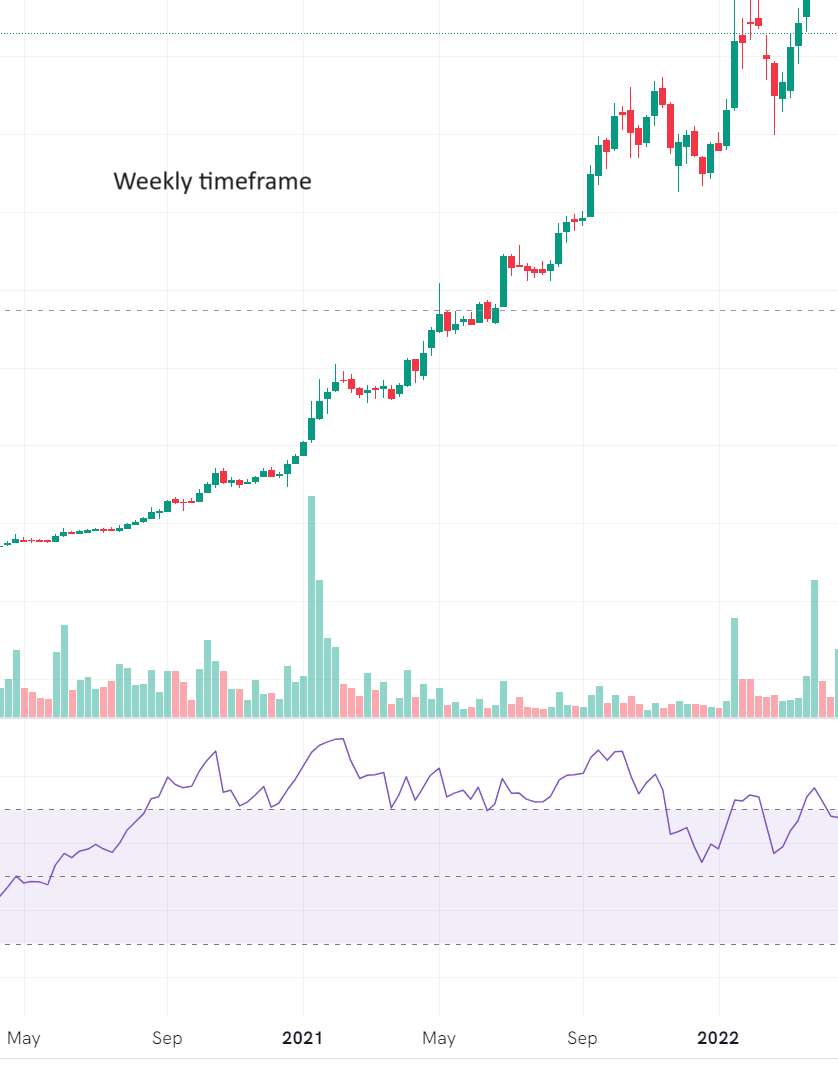
In times of Super strong trend, a shorter TF can have less RSI.
The shorter TF can give buying signals in continuation with the trend
In times of Super strong trend, a shorter TF can have less RSI.
The shorter TF can give buying signals in continuation with the trend
9/n
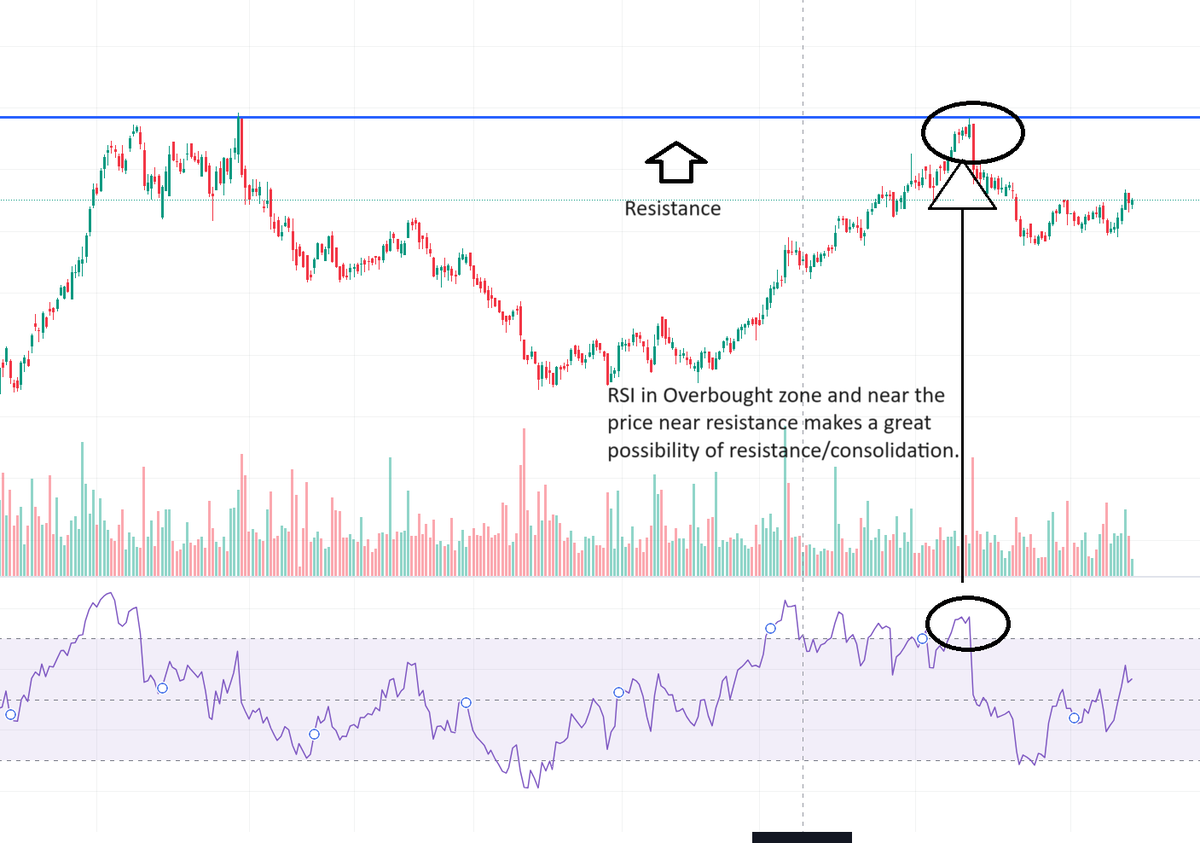
RSI near support resistance
When RSI is in overbought zone and and price near resistance then
Chances are very high that there will be consolidation/reversal
RSI near support resistance
When RSI is in overbought zone and and price near resistance then
Chances are very high that there will be consolidation/reversal
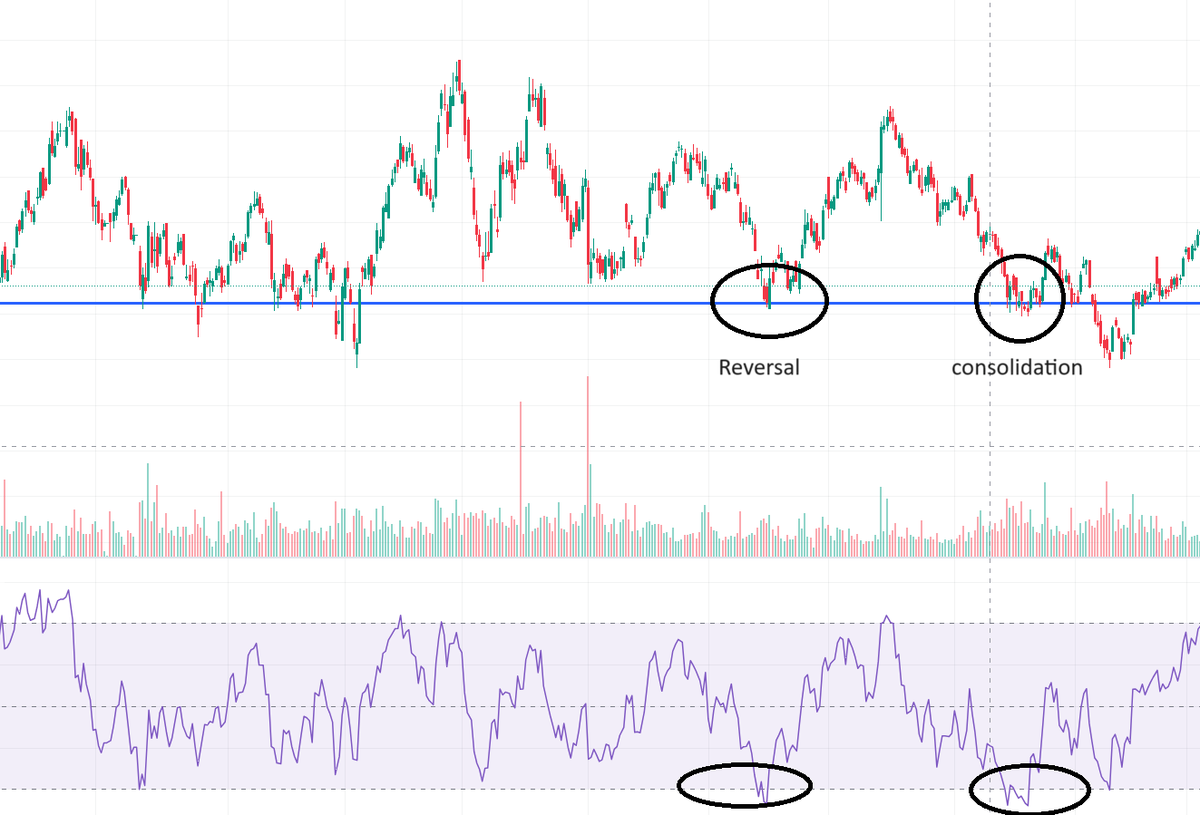
10/n
Same when RSI is oversold and the price near support
This happens because there is a limit to which a price can move in one go
Same when RSI is oversold and the price near support
This happens because there is a limit to which a price can move in one go
11/n
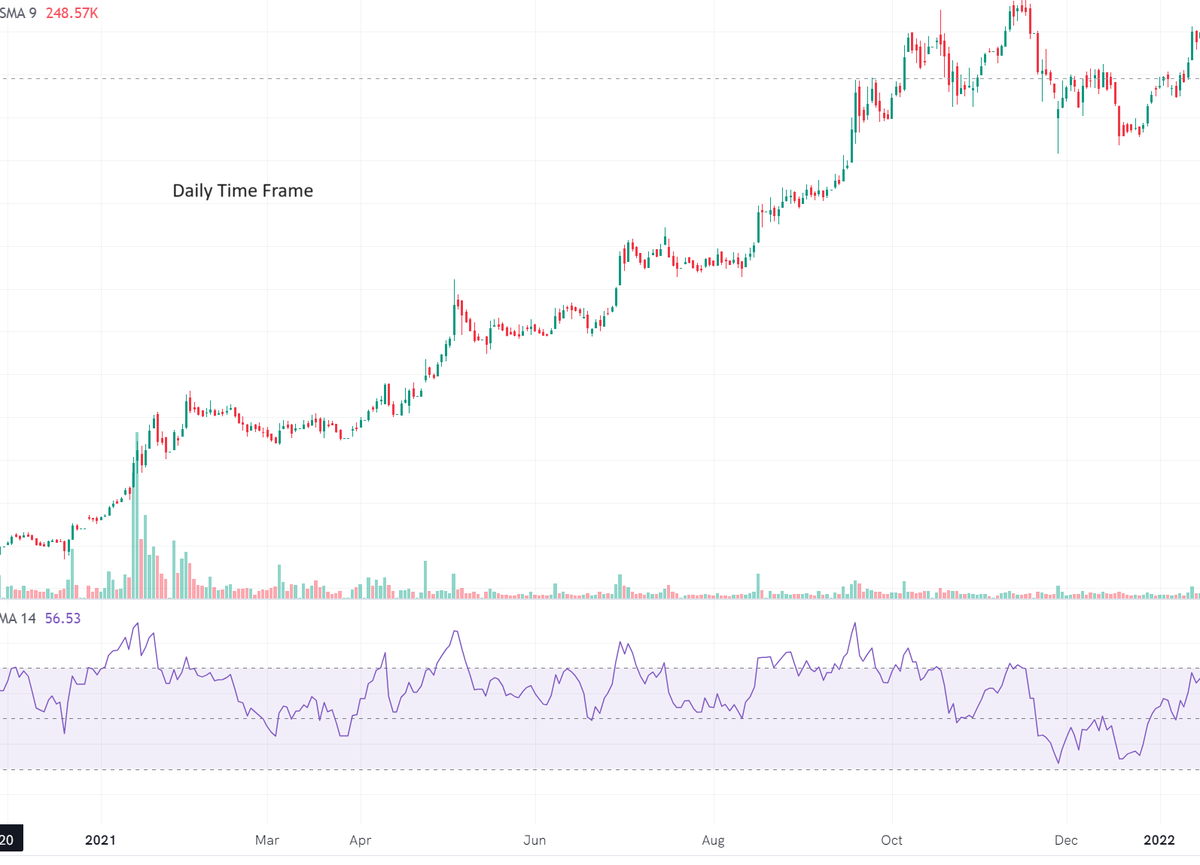
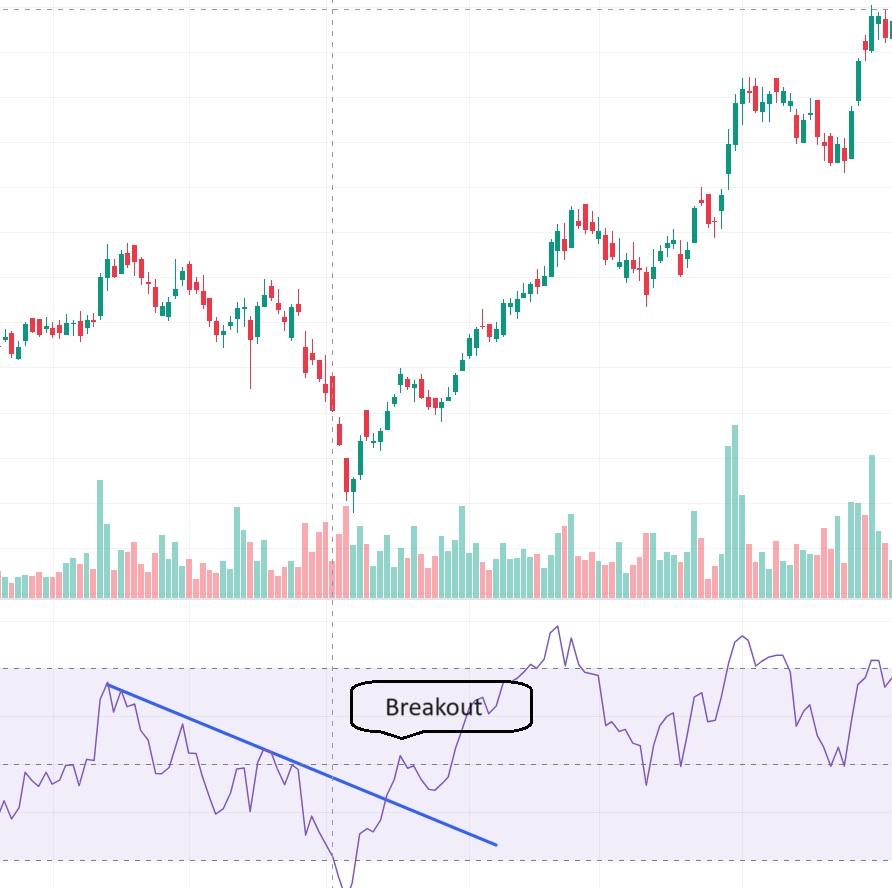
RSI Trendlines:
During a trend, Trendlines in RSI helps in identifying actual trend of market.
Uptrend: RSI moving in selected range forms trend by making higher highs in accordance with the stock
A Breakout in RSI signals trend reversal
RSI Trendlines:
During a trend, Trendlines in RSI helps in identifying actual trend of market.
Uptrend: RSI moving in selected range forms trend by making higher highs in accordance with the stock
A Breakout in RSI signals trend reversal
12/n
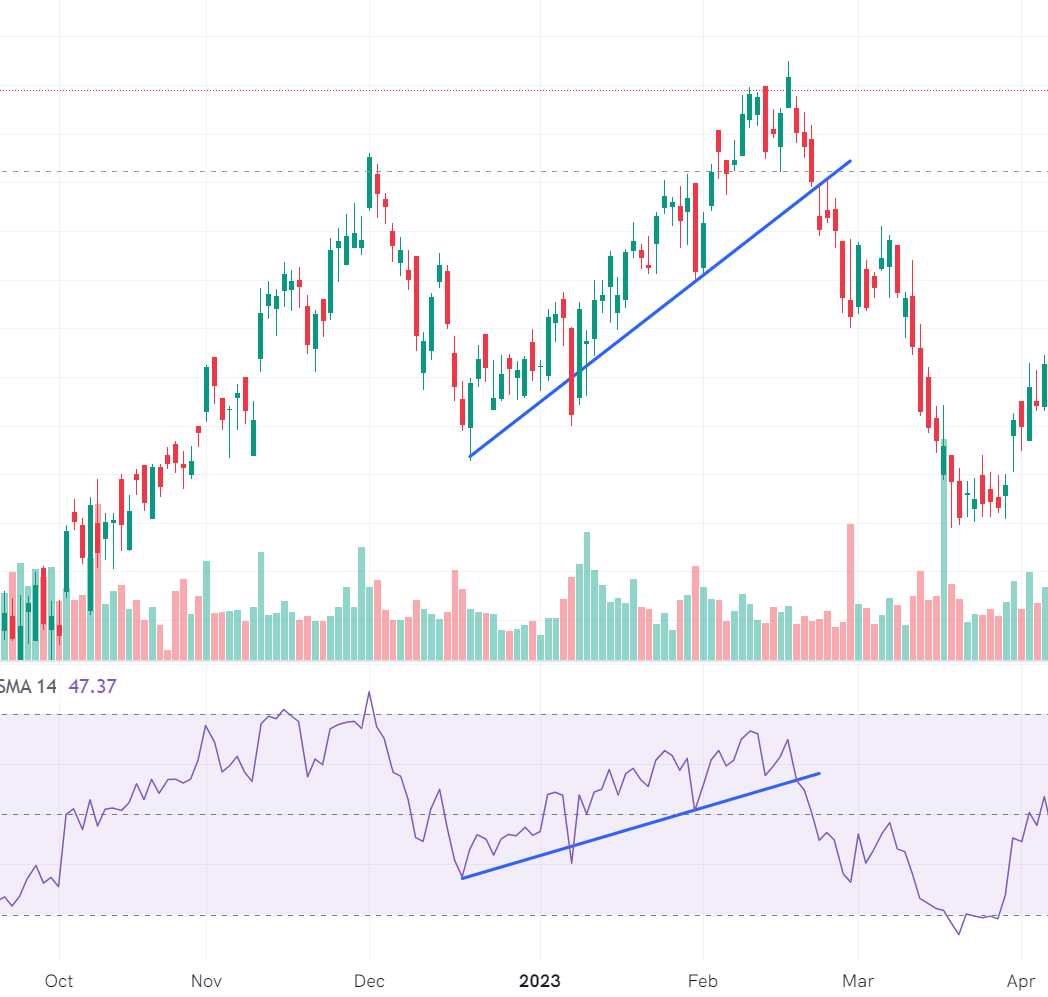
Downtrend: This logic can also be used in downtrend
The RSI breakout along with stock breakout gives conviction that there is trend reversal
Downtrend: This logic can also be used in downtrend
The RSI breakout along with stock breakout gives conviction that there is trend reversal
13/n
Golden Nuggets:
Keep in Mind that RSI is a lagging indicator. It helps you get info that your naked eye can’t see
RSI should always be clubbed with Price Action/ other indicators for better results
Golden Nuggets:
Keep in Mind that RSI is a lagging indicator. It helps you get info that your naked eye can’t see
RSI should always be clubbed with Price Action/ other indicators for better results
We keep posting such content for Stock Market.
If you liked the thread Please follow @RupeezyOfficial
Like and retweet the first tweet for max reach.
If you liked the thread Please follow @RupeezyOfficial
Like and retweet the first tweet for max reach.

جاري تحميل الاقتراحات...