

ICT Fibonacci - How To Use Them
A Thread 🧵
A Thread 🧵

1. Definition: The Fibonacci sequence is a series of numbers named after the Italian mathematician Leonardo of Pisa, also known as Fibonacci. It is defined by starting with two numbers, 0 and 1, and each subsequent number in the sequence is the sum of the two preceding ones.
2. Origin: Fibonacci introduced this sequence to the Western world through his book “Liber Abaci” in 1202. He used the sequence to describe the breeding of rabbits.
2. Origin: Fibonacci introduced this sequence to the Western world through his book “Liber Abaci” in 1202. He used the sequence to describe the breeding of rabbits.
3. Sequence: The sequence begins with 0, 1, and continues as 1, 2, 3, 5, 8, 13, 21, 34, 55, 89, 144, and so on.
4. Generation: To generate the sequence, you add the last two numbers to obtain the next number. For example, 1 + 1 = 2, 1 + 2 = 3, 2 + 3 = 5, and so on.
5. Applications: The Fibonacci sequence has important applications in various fields including mathematics, computer science, trading, and financial markets like crypto. It is utilized in areas such as algorithm analysis, number theory, and predicting market trends.

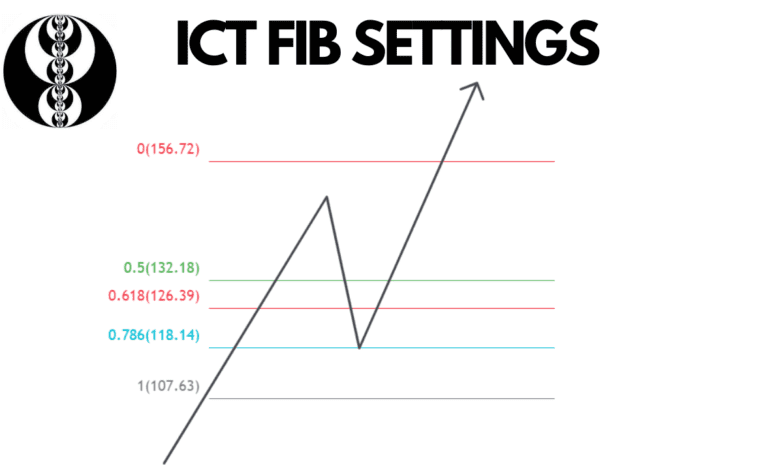
ICT Fibonacci Levels
ICT Fib level are those level where we can find optimal trade entry(OTE).
These level and their descriptions are given below.
ICT Fib level are those level where we can find optimal trade entry(OTE).
These level and their descriptions are given below.

ICT Fib Settings Tradingview
For setting ict Fibonacci level on trading view do the following
- To use Fibonacci retracements for trade entries and take profit zones, follow these steps:
Set up Fibonacci Settings: Click on the Fibonacci retracement tool in your trading platform.
Place it on the chart by clicking and dragging from the swing high to the swing low (or vice versa) that you want to use as reference points.
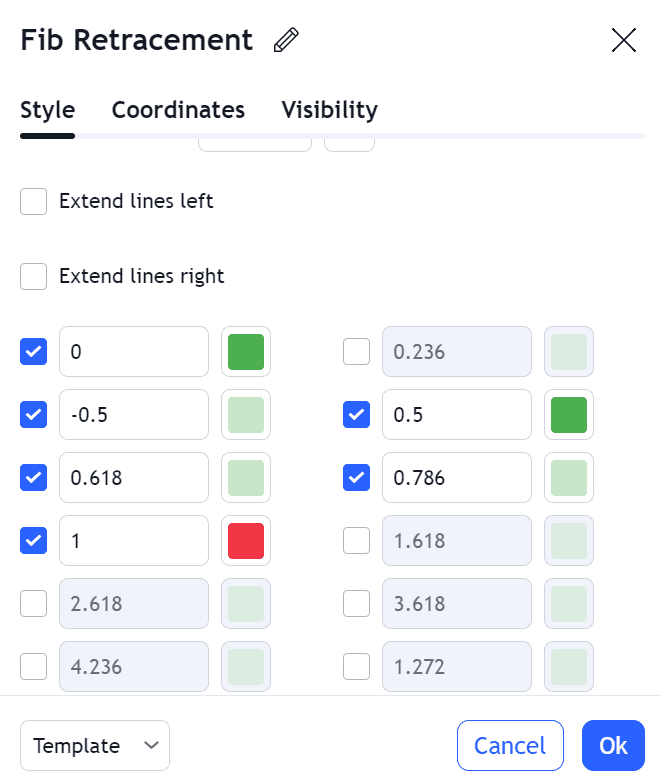
Adjust Fibonacci Levels:
- Double-click the Fibonacci retracement tool on the chart.
- Right-click on the tool to access the settings.
- Go to “Fib levels” and modify the levels as follows:
- After setting the levels, click “Save” to apply the changes.
- Double-click the Fibonacci retracement tool on the chart.
- Right-click on the tool to access the settings.
- Go to “Fib levels” and modify the levels as follows:
- After setting the levels, click “Save” to apply the changes.
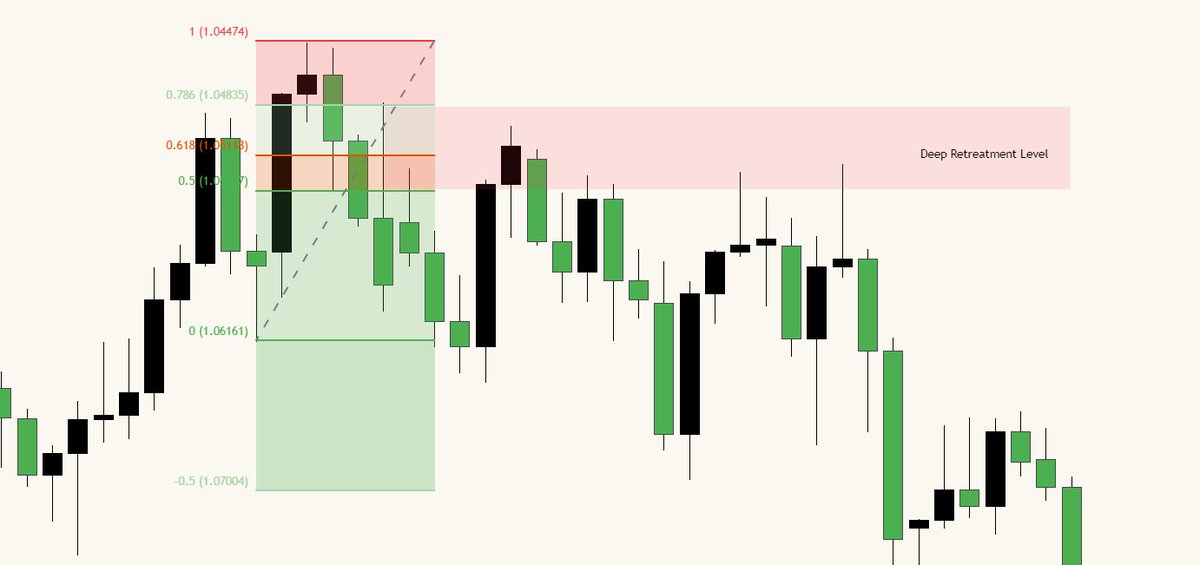
How to Apply ICT Fib Settings on Chart
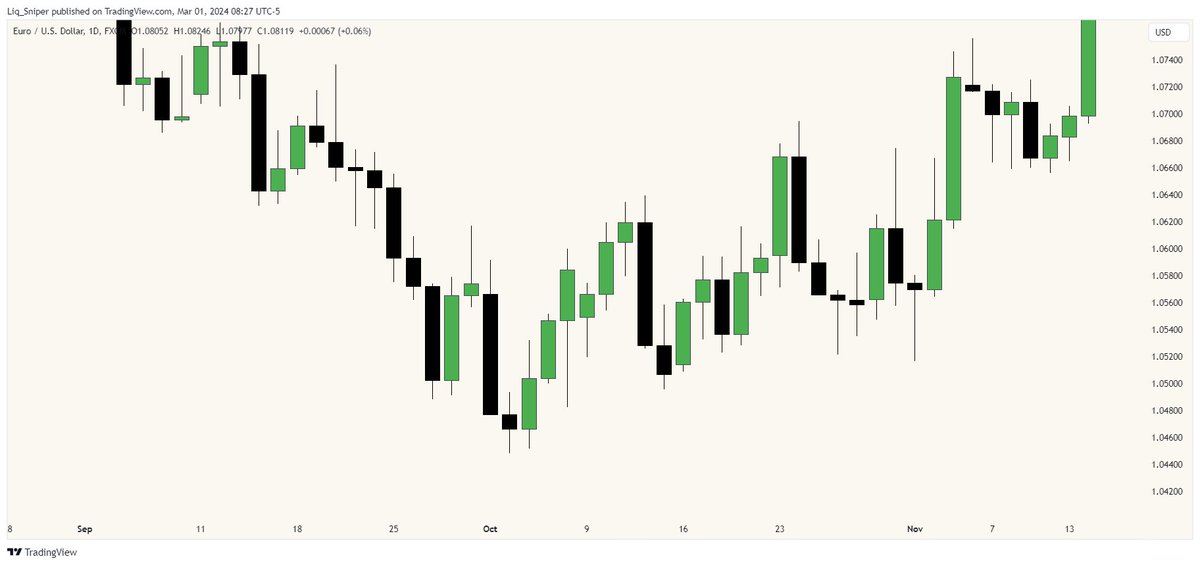
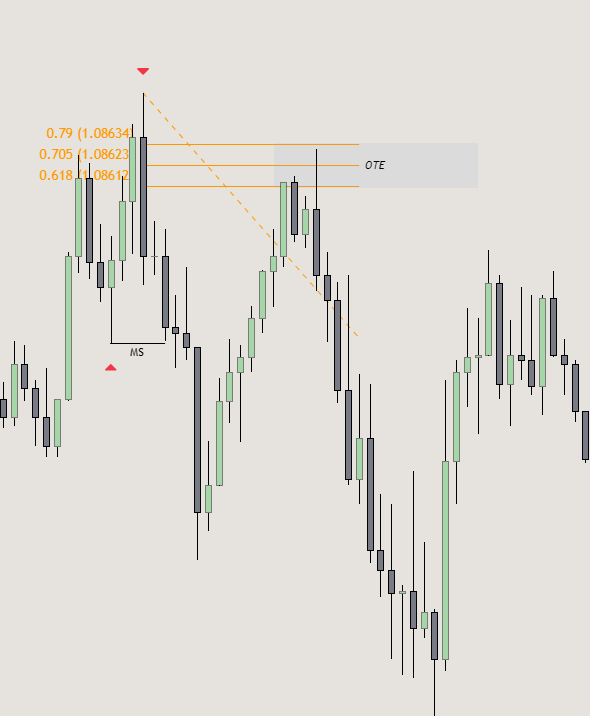
In the ICT trading strategy, when using Fibonacci retracement levels, we place the tool from the lowest point to the highest point of the candle’s body if the market is going up (bullish momentum) and from higher to lower in bearish momentum.
In the ICT trading strategy, when using Fibonacci retracement levels, we place the tool from the lowest point to the highest point of the candle’s body if the market is going up (bullish momentum) and from higher to lower in bearish momentum.

- The highs and lows of candles can vary between brokers, diminishing their reliability in trading.
- By concentrating on the bodies of the candles instead, we can pinpoint optimal trade entry points with substantial profit potential.
- This strategy remains effective regardless of the broker used, enhancing our ability to make informed trading decisions.
- Ultimately, this approach boosts the likelihood of executing successful trades.
ICT Optimal Trade Entry (OTE)
- ICT Optimal Trade Entry (OTE) is a crucial aspect of the ICT trading strategy.
- OTE levels denote significant retracements in the market.
- Traders scout for specific entry setups at these OTE levels.
- Identification of OTE levels marks potential trade opportunities.
- Traders seek setups signaling a likely reversal from the retracement, aligning with the overall trend.
- Focusing on OTE levels allows traders to locate favorable entry points with a promising risk-to-reward ratio.
Detail thread about OTE MODEL :
x.com
x.com
Join for Educational content and weekly layout : t.me

I use to trade @DeiFunded
Best Support In The Industry 𝗕𝘂𝘆 𝗼𝗻𝗲 𝗴𝗲𝘁 𝗼𝗻𝗲 𝗳𝗿𝗲𝗲 +
𝟱𝟬% OFF Limited🤯Code : BOGO50
deifunded.com
Best Support In The Industry 𝗕𝘂𝘆 𝗼𝗻𝗲 𝗴𝗲𝘁 𝗼𝗻𝗲 𝗳𝗿𝗲𝗲 +
𝟱𝟬% OFF Limited🤯Code : BOGO50
deifunded.com

جاري تحميل الاقتراحات...