

#DataScience meets #Quant #Finance:
Can we use Anomaly detection to identify buy/sell patterns?
Anomaly detection for stocks in 4 steps.
A thread with #Python code 🧵
Can we use Anomaly detection to identify buy/sell patterns?
Anomaly detection for stocks in 4 steps.
A thread with #Python code 🧵

Step 1: Load libraries and Stock Data
Load Pandas and our new PyTimeTK package.
Then import OHLCV stock data with adjusted close.
Load Pandas and our new PyTimeTK package.
Then import OHLCV stock data with adjusted close.

Step 2: Apply Anomaly Detection
We've done something cool!
You can use the .anomalize() method to identify anomalies in 1 line of code.
We've done something cool!
You can use the .anomalize() method to identify anomalies in 1 line of code.

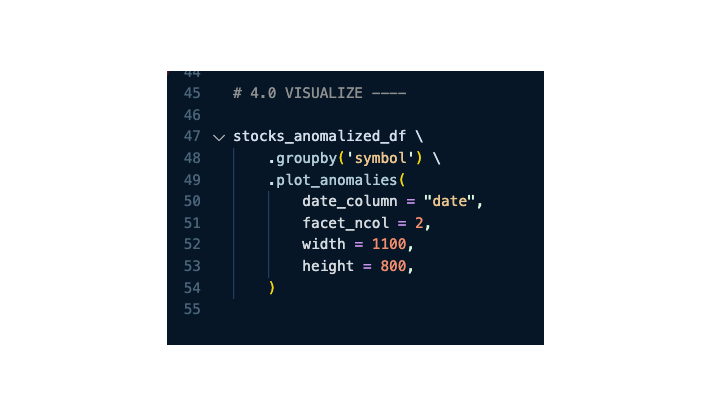
Step 3: Visualize the Anomalies
Use .plot_anomalies() to simplify the anomaly visualization process.
Use .plot_anomalies() to simplify the anomaly visualization process.
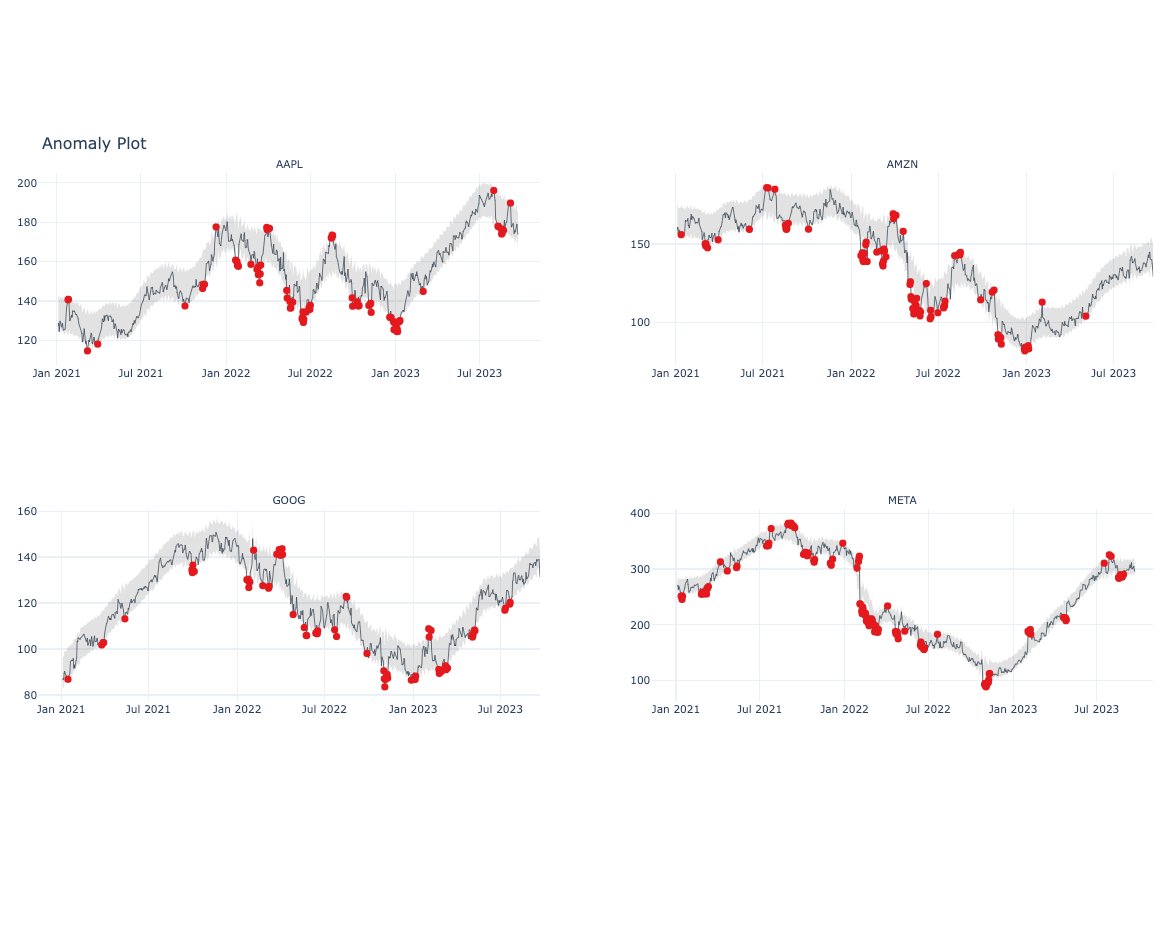
Step 4: Evaluate the Visualization for Buy/Sell Patterns
The red dots are the anomalies.
The gray region is the normal trading region.
And there you go- buy/sell patterns emerge.
The red dots are the anomalies.
The gray region is the normal trading region.
And there you go- buy/sell patterns emerge.
If you like this post, we have a live course event where we will teach you how to build algorithmic trading strategies that actually work.
👉Join our live course launch event here (drops Monday): us02web.zoom.us
👉Join our live course launch event here (drops Monday): us02web.zoom.us

جاري تحميل الاقتراحات...