

It's interesting, because I think the actual data here shows very little connection to COVID-19 and Long COVID at all
In fact, the data seems to indicate a relatively small number out of the workforce in the UK due to LC
In fact, the data seems to indicate a relatively small number out of the workforce in the UK due to LC
There are several reasons for this
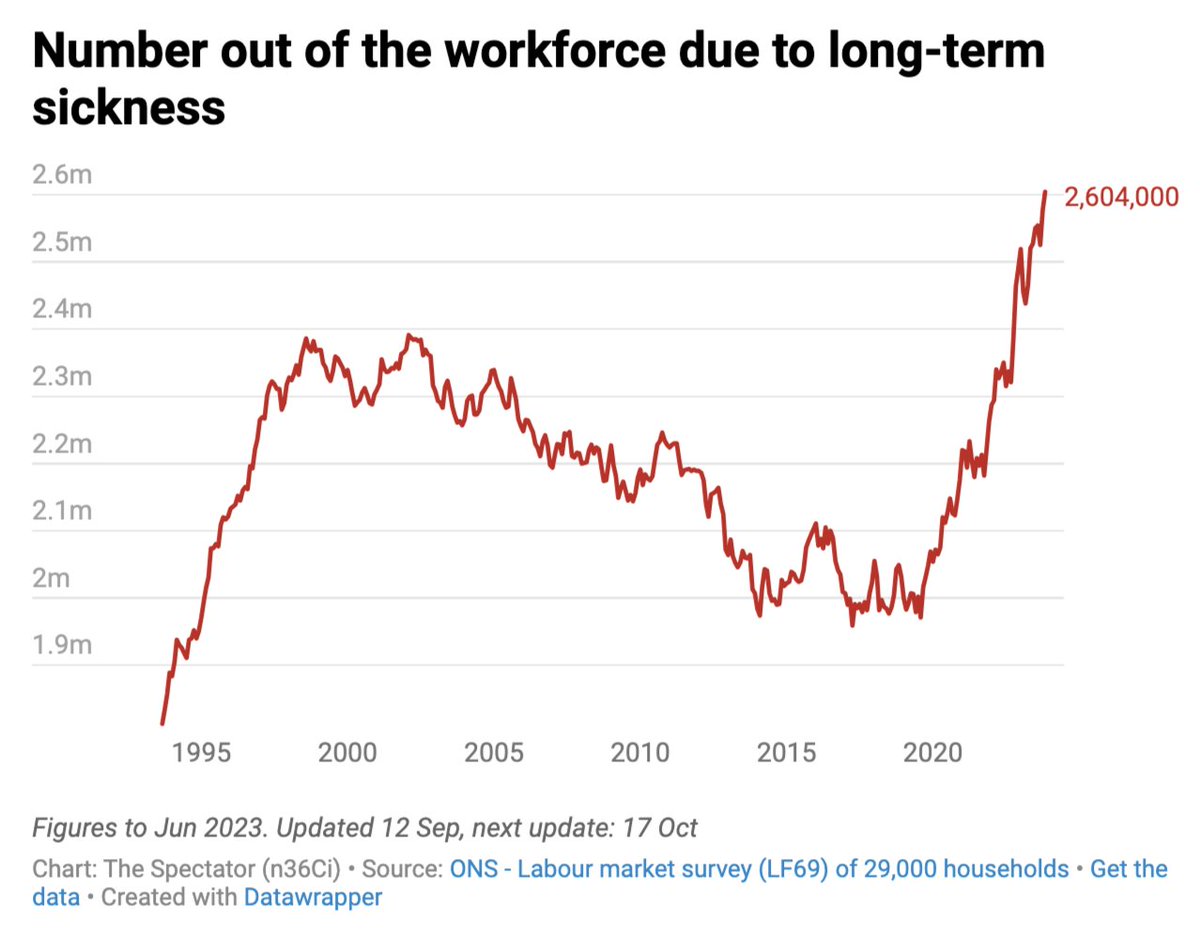
The first is that the above graph is VERY misleading!
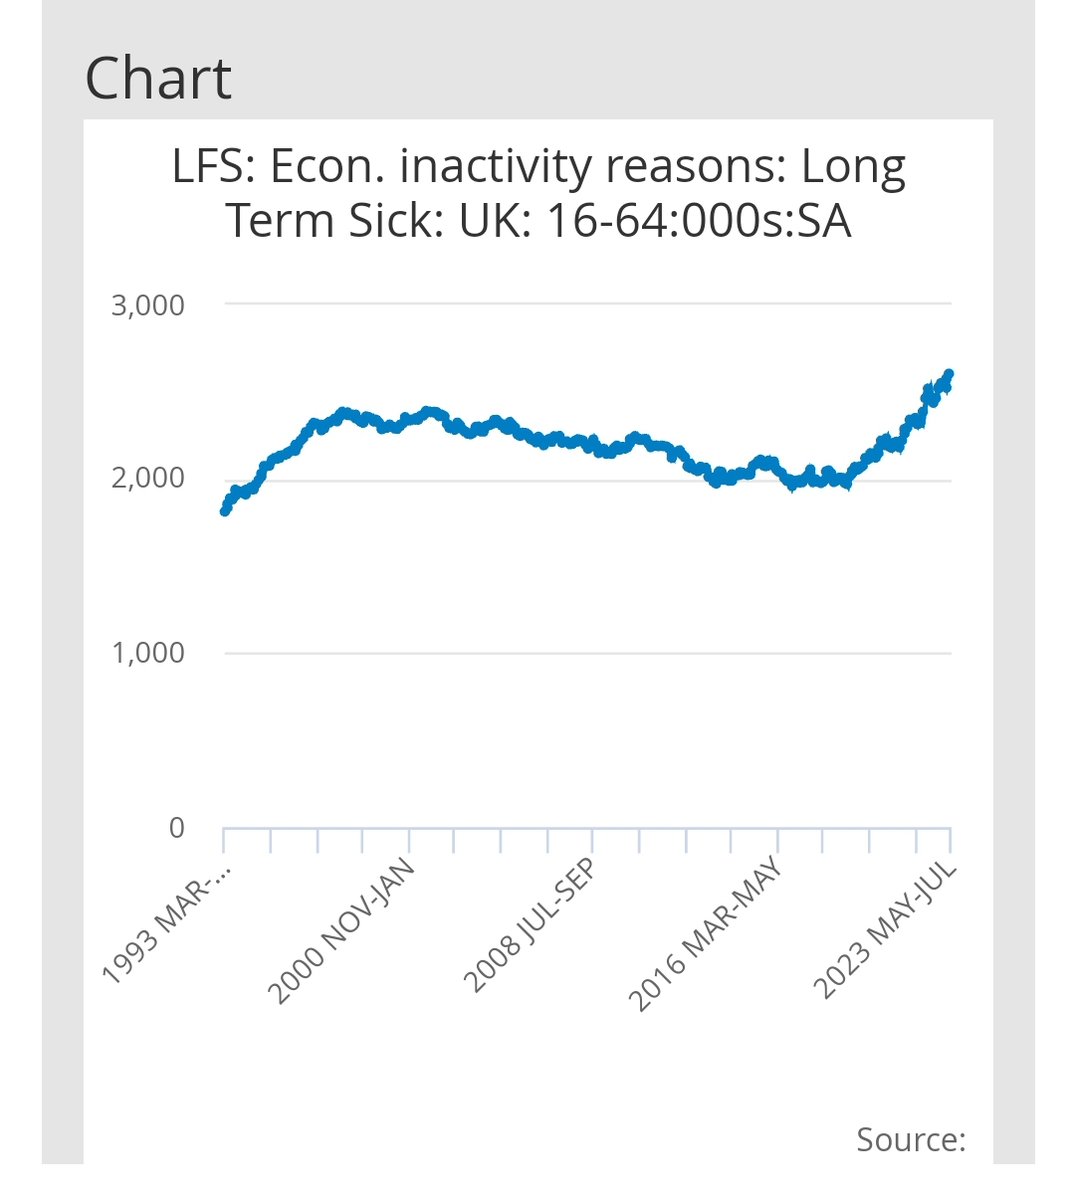
Here's the original data from the ONS. See the difference?
The first is that the above graph is VERY misleading!
Here's the original data from the ONS. See the difference?
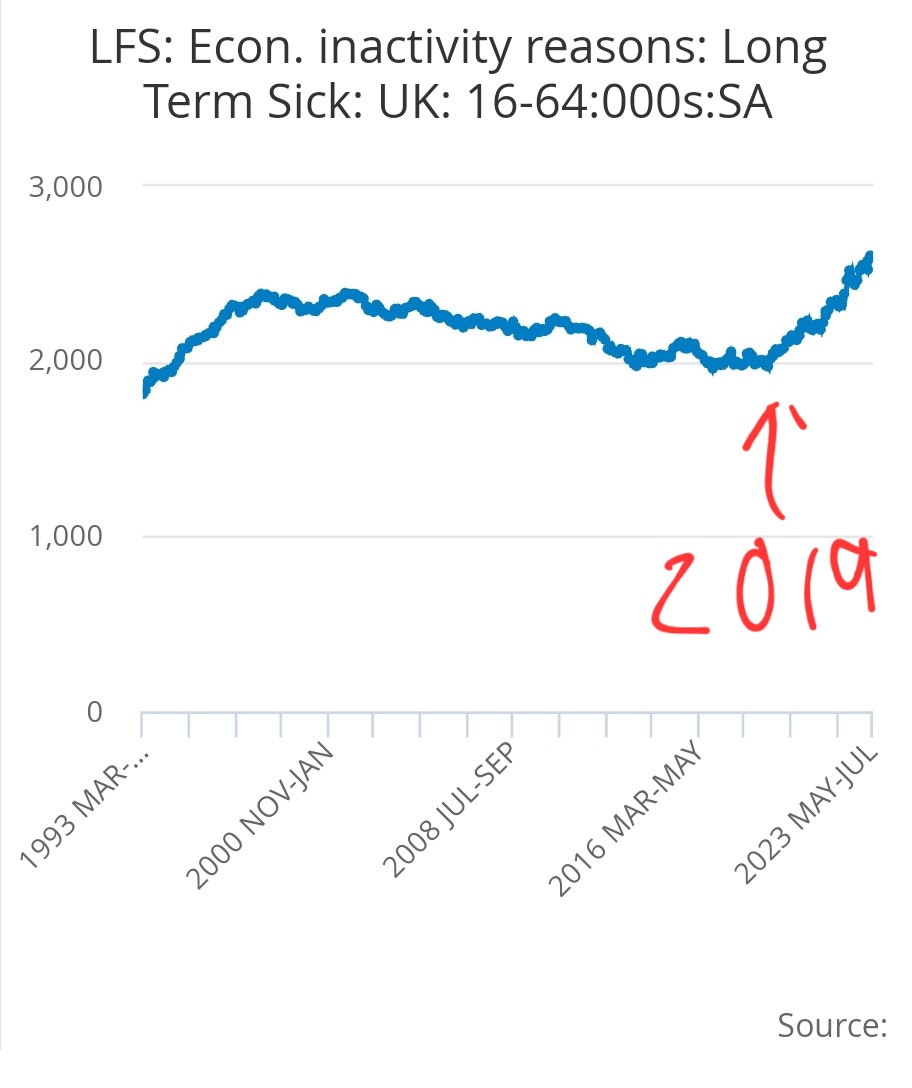
One hugely important point - the increase started in 2019. In fact, the increase in people out of work due to long term sickness in the UK was BIGGER in 2019 than in 2020. About the same between 2019 and 2021
Just look at the 5-year data. With correctly labelled axes, and a y-axis that starts at 0 rather than 1.9mil, you can see that there's not much direct correlation to COVID-19 here
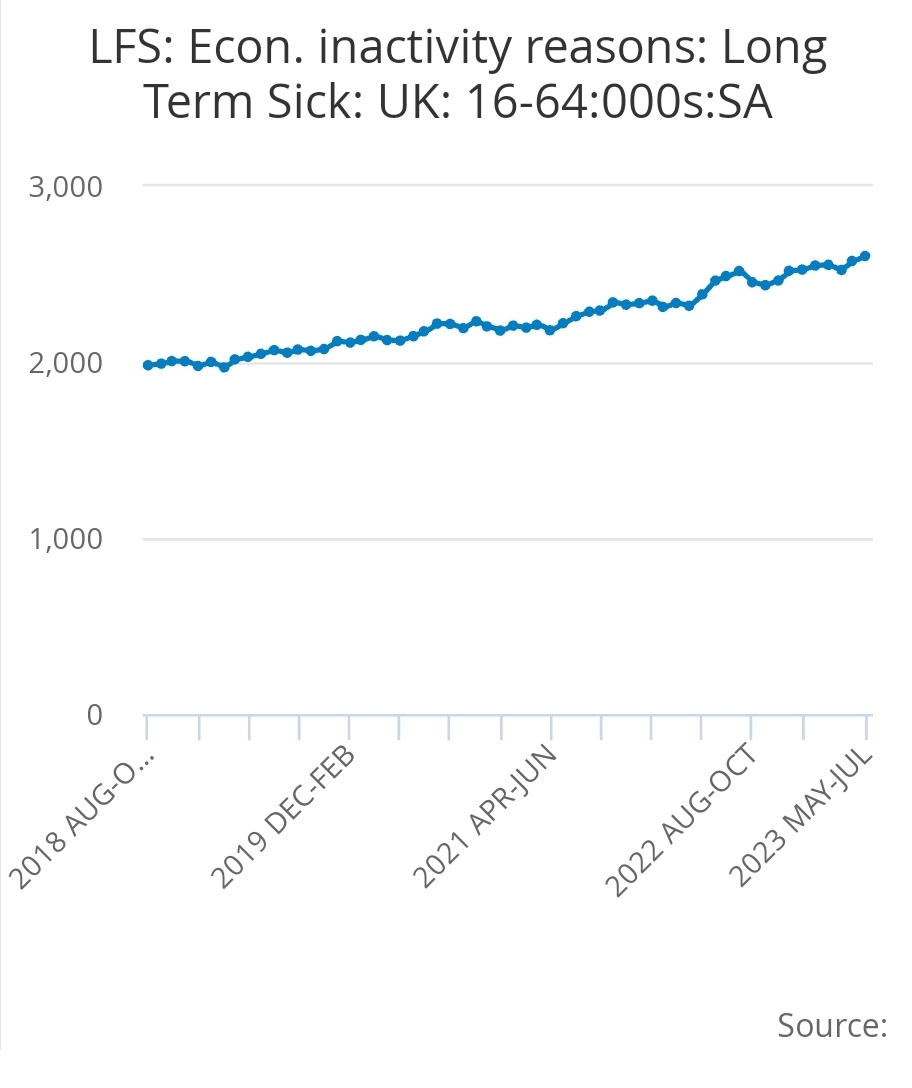
And, importantly, there is really not much correlation with 2020/21. Based on ONS statistics, we know that the majority of people in the UK reporting LC had their infections in the first 2 years of the pandemic
ons.gov.uk
ons.gov.uk

On top of that, we've also got direct evidence of the number of people reporting long-term inactivity due to Long COVID
This study estimated it was ~27k people in mid-2022
medrxiv.org
This study estimated it was ~27k people in mid-2022
medrxiv.org
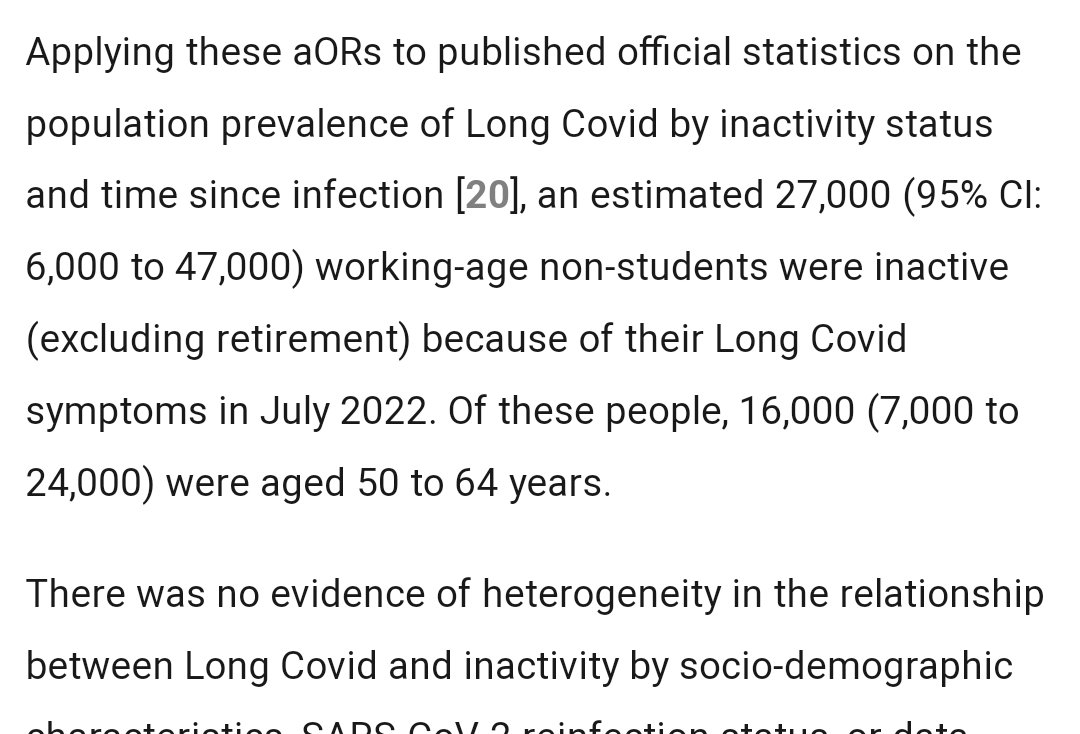

That's not a small number!
But it is also not a large portion of this increase. If this study is correct, then Long COVID represents just 4-5% of the increase in inactivity since 2019. 7% since 2020
But it is also not a large portion of this increase. If this study is correct, then Long COVID represents just 4-5% of the increase in inactivity since 2019. 7% since 2020
Anyway, it's a very complex topic, and none of this is the least bit certain, but I think the graph above is very misleading, and even just looking at the release from the ONS shows a very different story regarding Long COVID
And just to be clear - obviously SOME of this increase is directly related to COVID-19/Long COVID
But the % seems much smaller than you might imagine from the original graph!
But the % seems much smaller than you might imagine from the original graph!
جاري تحميل الاقتراحات...