

✅Clustering in Machine Learning - Explained in simple terms with implementation details (code, techniques and best tips).
A quick thread 👇🏻🧵
#MachineLearning #DataScientist #Coding #100DaysofCode #hubofml #deeplearning #DataScience
PC : ResearchGate
A quick thread 👇🏻🧵
#MachineLearning #DataScientist #Coding #100DaysofCode #hubofml #deeplearning #DataScience
PC : ResearchGate
1/ Imagine you have a bunch of colorful marbles, but they are all mixed up and you want to organize them. Clustering in machine learning is like finding groups of marbles that are similar to each other.
2/ You know how some marbles are big and some are small? And some are red, while others are blue or green? Clustering helps us put marbles that are similar in size or color together in the same groups. So, all the big red marbles might be in one group, and rest in another group
3/ Machine learning uses mathematics to look at the marbles and decide which ones should be in the same group. Just like when you look at the marbles and put them together based on how they look alike.
4/ Clustering in ML refers to the process of grouping similar data points together based on certain features or characteristics they share. The goal of clustering is to identify inherent patterns and structures within a dataset without any prior knowledge of the class labels
5/ Clustering aims to discover natural groupings within the data, where data points within the same group are more similar to each other than to those in other groups.Clustering is an unsupervised learning technique.
6/ It doesn't require labeled data for training. Instead, it relies on the inherent structure of the data to form clusters. Clustering can help uncover hidden patterns, segment data, identify outliers, and provide insights into the underlying relationships between data points.

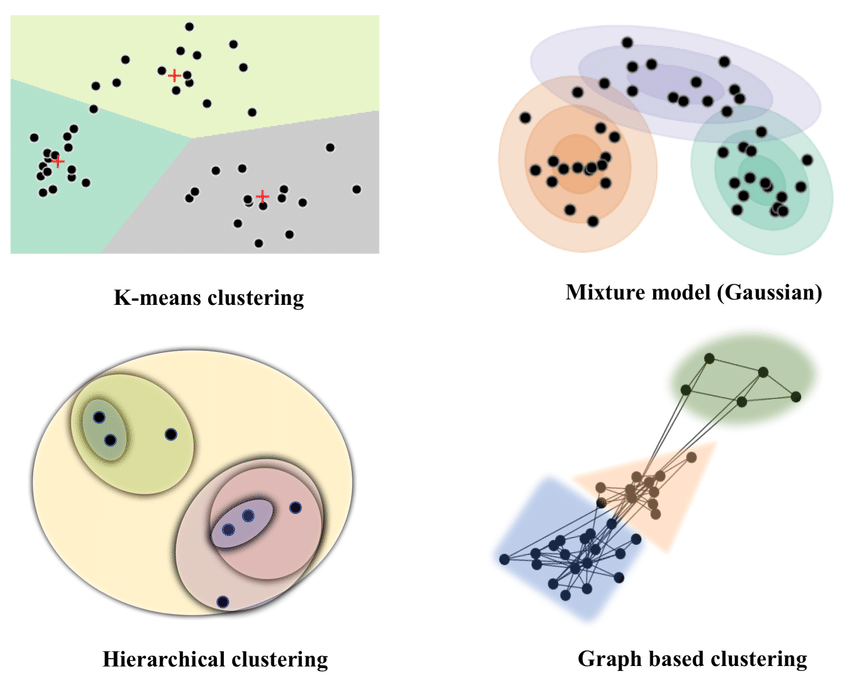
7/ Hierarchical Clustering:
Hierarchical Clustering is a type of clustering where data points are grouped into a hierarchy of clusters. It creates a tree-like structure (dendrogram) of clusters by repeatedly merging or splitting clusters based on their similarity.
Hierarchical Clustering is a type of clustering where data points are grouped into a hierarchy of clusters. It creates a tree-like structure (dendrogram) of clusters by repeatedly merging or splitting clusters based on their similarity.

8/ Partitioning Clustering:
Partitioning Clustering involves dividing data points into distinct non-overlapping subsets or clusters. These algorithms aim to optimize a certain criterion, often the distance between data points within the same cluster.
Partitioning Clustering involves dividing data points into distinct non-overlapping subsets or clusters. These algorithms aim to optimize a certain criterion, often the distance between data points within the same cluster.
9/ K-Means Algorithm: It starts by randomly placing "k" centroids in the data space, where "k" is the desired number of clusters. Data points are then assigned to the nearest centroid, and centroids are updated based on the mean of the points in each cluster.

10/ K-Medoids Algorithm:K-Medoids is similar to K-Means but uses actual data points as cluster representatives (medoids) instead of centroids. It's more robust to outliers since it selects real data points as cluster centers.
11/ Density-Based Clustering:
Density-Based Clustering identifies clusters by considering regions of higher data point density. It's effective in finding irregularly shaped clusters and is less influenced by noise.
Density-Based Clustering identifies clusters by considering regions of higher data point density. It's effective in finding irregularly shaped clusters and is less influenced by noise.
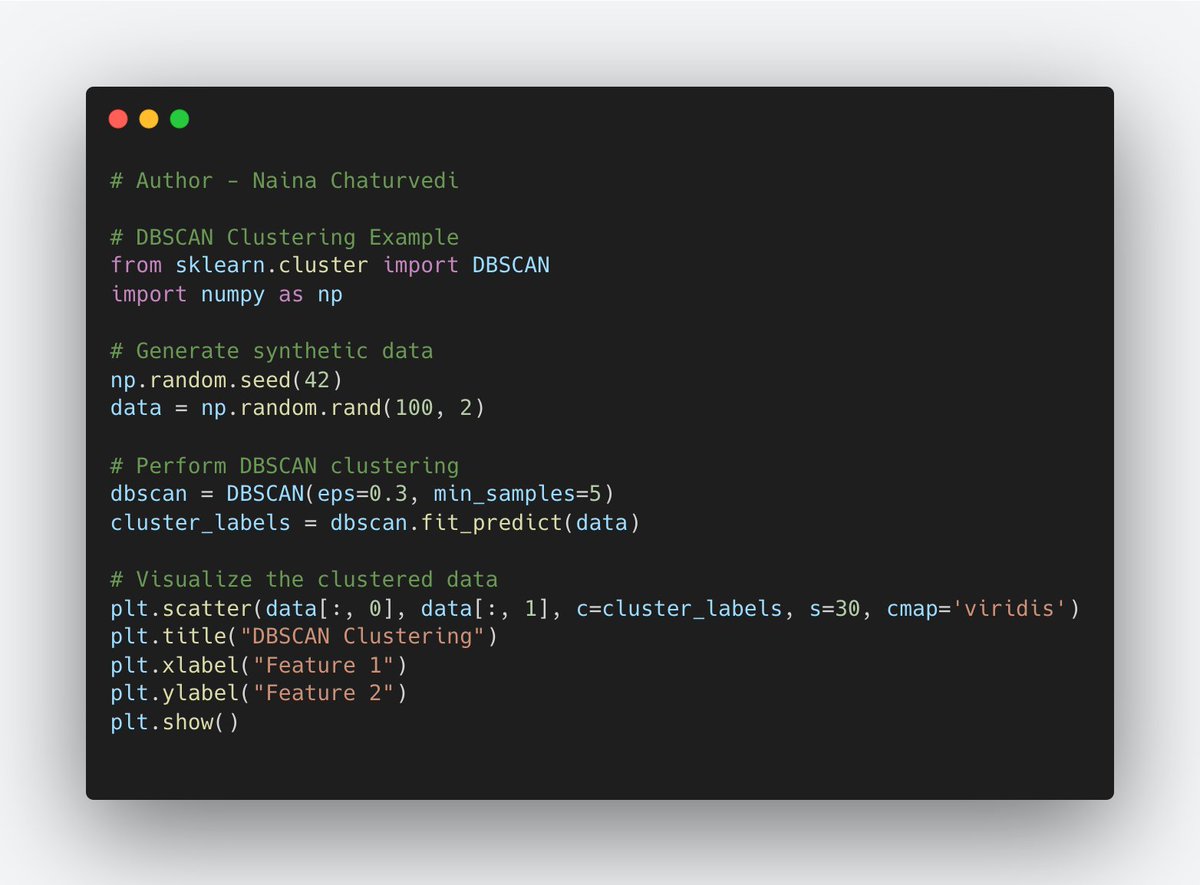
12/ DBSCAN Algorithm:DBSCAN (Density-Based Spatial Clustering of Applications with Noise) identifies clusters by defining regions of high point density as clusters. It starts from a data point and expands cluster by connecting to neighboring points within a specified distance
13/ Model-Based Clustering:
Model-Based Clustering involves fitting statistical models to data and using them to identify clusters. It assumes that data points are generated from a mixture of underlying probability distributions.
Model-Based Clustering involves fitting statistical models to data and using them to identify clusters. It assumes that data points are generated from a mixture of underlying probability distributions.
14/ Gaussian Mixture Models (GMM):GMM assumes that data points are generated from a mixture of several Gaussian distributions. It estimates the parameters of these distributions to find the best-fit clusters.

15/ Distance Metrics:
Distance metrics are mathematical formulas that help us measure how far apart or similar two data points are in a given space. They are crucial in clustering, classification, and similarity analysis.
Distance metrics are mathematical formulas that help us measure how far apart or similar two data points are in a given space. They are crucial in clustering, classification, and similarity analysis.
16/ Euclidean Distance:
Description:Euclidean distance is straight-line distance between two points in a Euclidean space. It's like the distance you would measure with a ruler.
Relevance: It's used when the data points have numerical features and the space is well-defined.
Description:Euclidean distance is straight-line distance between two points in a Euclidean space. It's like the distance you would measure with a ruler.
Relevance: It's used when the data points have numerical features and the space is well-defined.

17/ Manhattan Distance:
It is the sum of the absolute differences between corresponding coordinates of two points.
Relevance:Used when movement can only occur along grid lines . It's robust to outliers and can work well for data with categorical features.
It is the sum of the absolute differences between corresponding coordinates of two points.
Relevance:Used when movement can only occur along grid lines . It's robust to outliers and can work well for data with categorical features.

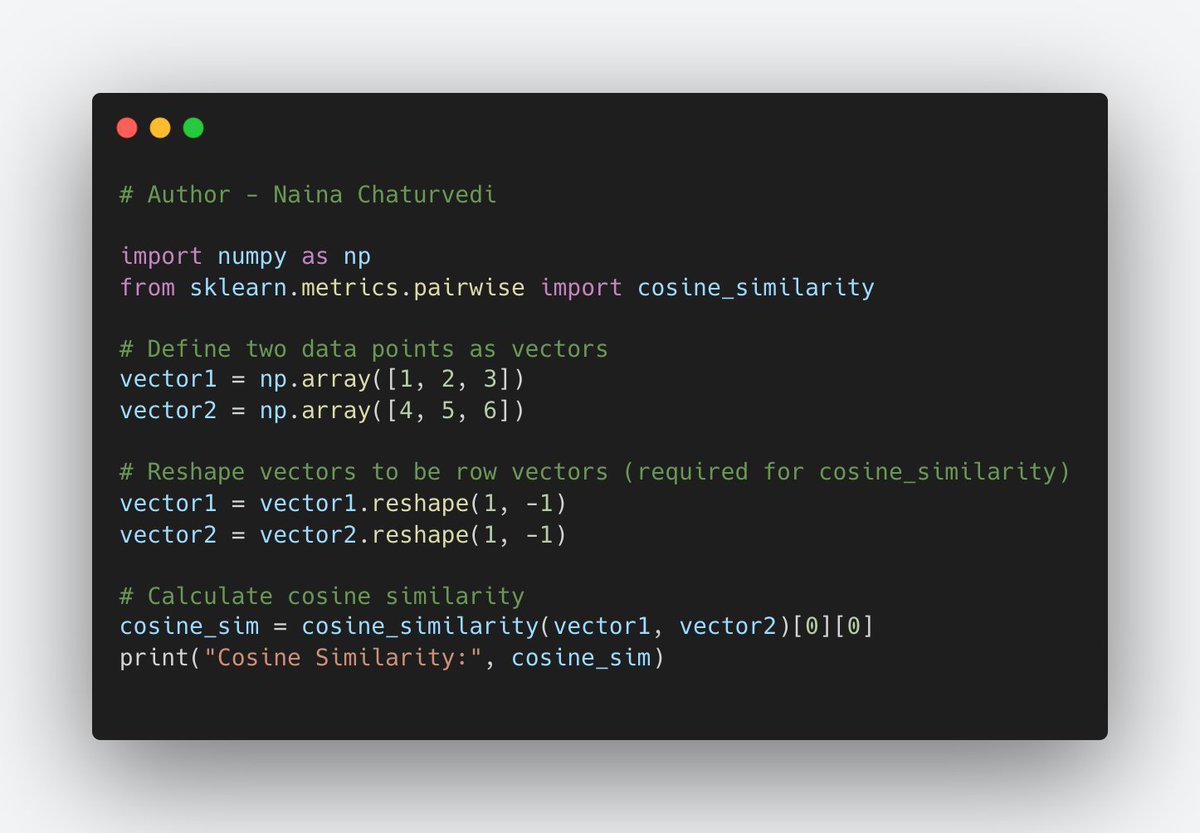
18/ Cosine Similarity:
It measures the cosine of the angle between two vectors in a high-dimensional space. It indicates how similar the directions of the vectors are, irrespective of their magnitudes.
It measures the cosine of the angle between two vectors in a high-dimensional space. It indicates how similar the directions of the vectors are, irrespective of their magnitudes.
19/ Data preprocessing is a crucial step in preparing data for clustering algorithms. Clean and well-preprocessed data can lead to more accurate and meaningful clusters.
20/ Normalization: Clustering algorithms are sensitive to scale of features. If features have different scales, some features might dominate distance calculations, leading to biased clustering. Normalizing ensures that each feature contributes equally to distance calculations.

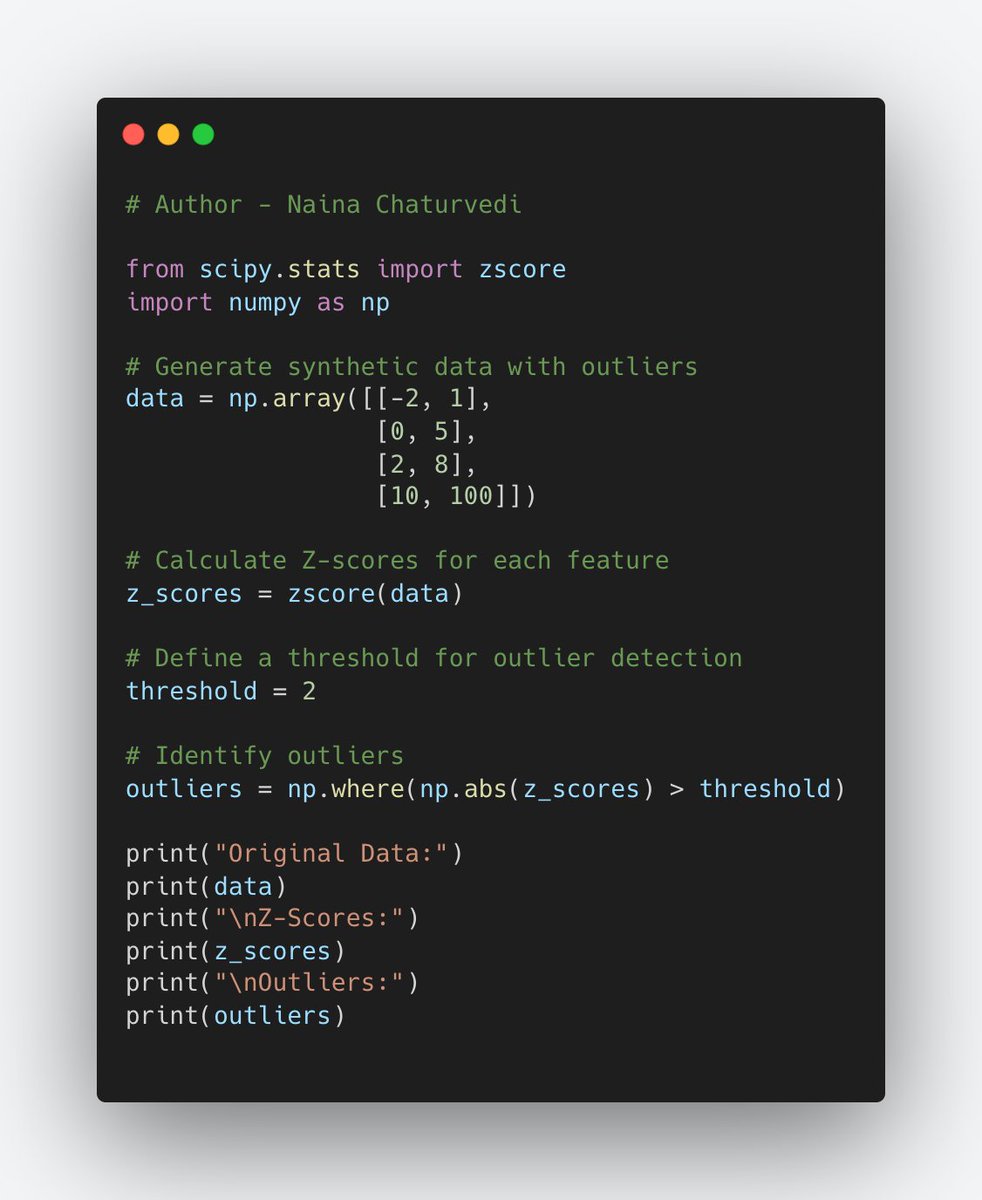
21/ Outlier Handling: Outliers can heavily influence clustering results by pulling clusters towards them. Detecting and dealing with outliers helps maintain the integrity of the clusters.
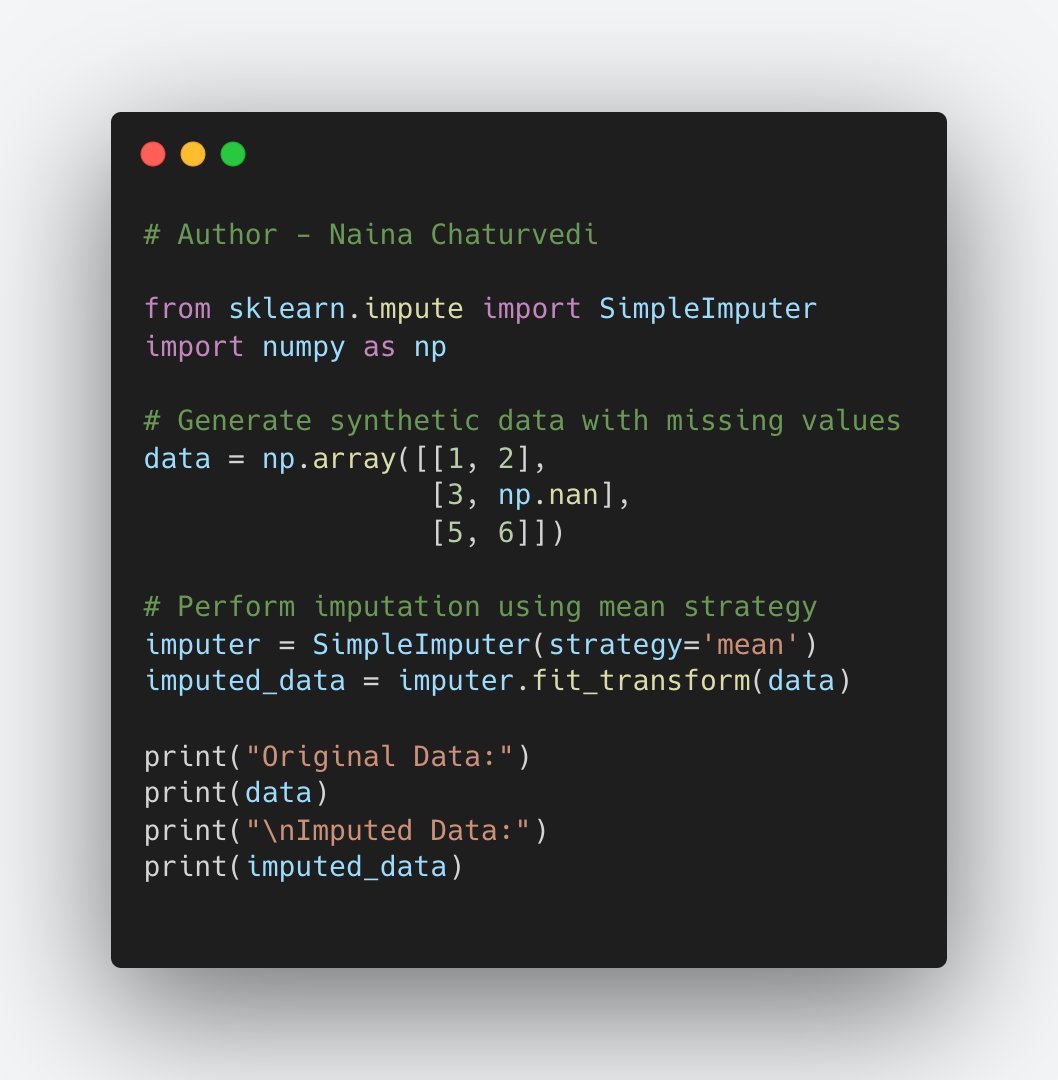
22/ Handling Missing Values: Clustering algorithms may not handle missing values well. You need to decide whether to remove data points with missing values or impute them with reasonable values.
23/ Elbow Method:
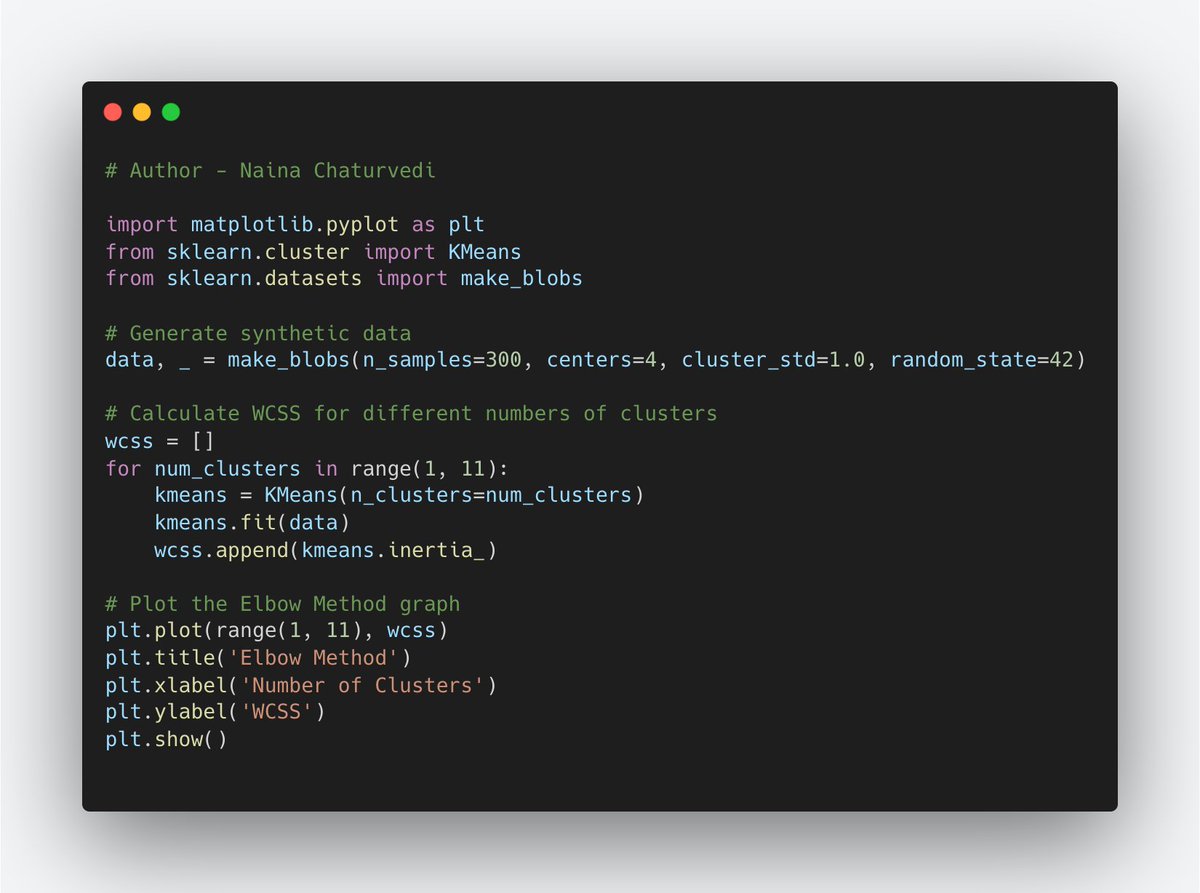
Description:The Elbow Method is a graphical technique to determine the optimal number of clusters for the k-means algorithm. It involves plotting the number of clusters against the within-cluster sum of squares (WCSS).
Description:The Elbow Method is a graphical technique to determine the optimal number of clusters for the k-means algorithm. It involves plotting the number of clusters against the within-cluster sum of squares (WCSS).
24/ It measures the total variance within each cluster. The point where the WCSS starts to decrease less significantly resembles an "elbow" and is considered a good estimate for the number of clusters.
25/ Silhouette Score:
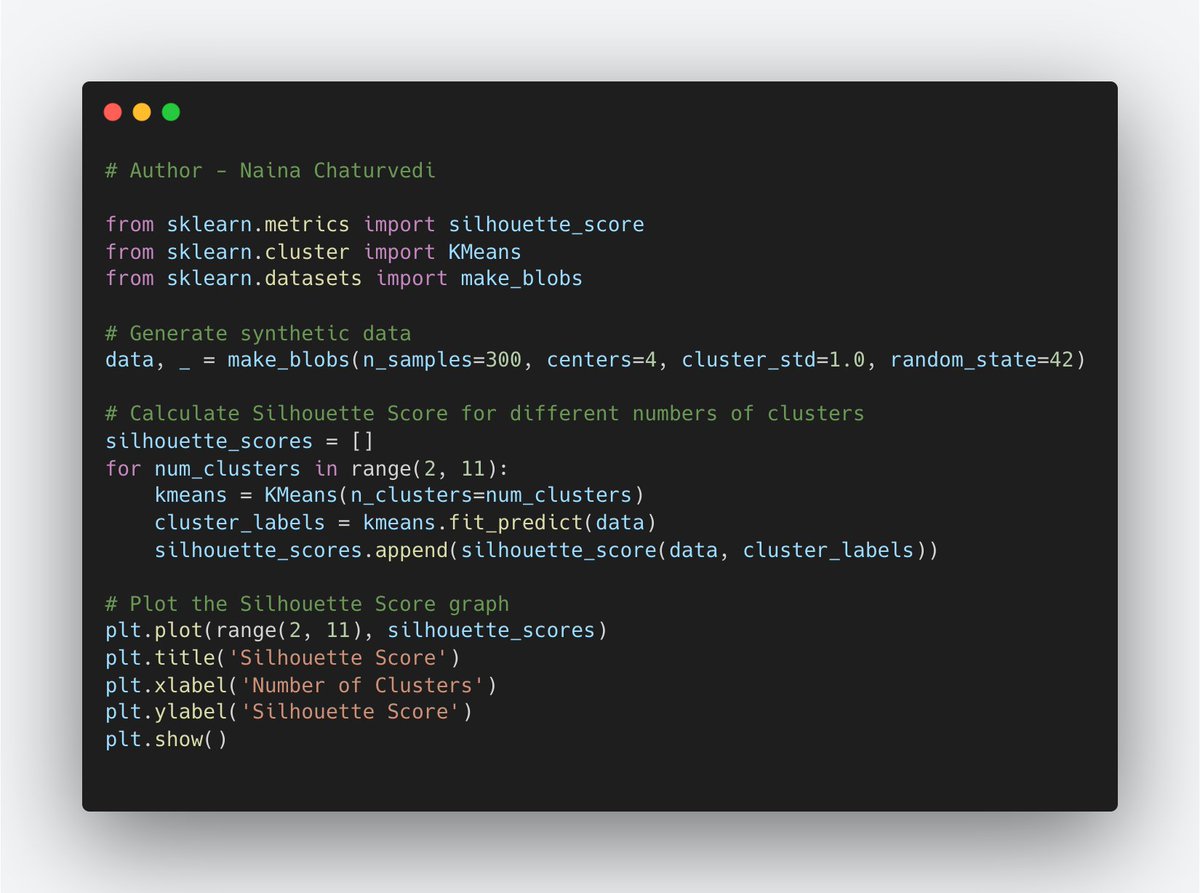
It measures how similar an object is to its own cluster (cohesion) compared to other clusters (separation). It ranges from -1 to 1, where higher values indicate better-defined clusters.
It measures how similar an object is to its own cluster (cohesion) compared to other clusters (separation). It ranges from -1 to 1, where higher values indicate better-defined clusters.
26/ Inertia:
It measures how compact the clusters are. Lower inertia indicates that points within the same cluster are closer to each other.
It measures how compact the clusters are. Lower inertia indicates that points within the same cluster are closer to each other.

27/ Adjusted Rand Index (ARI):
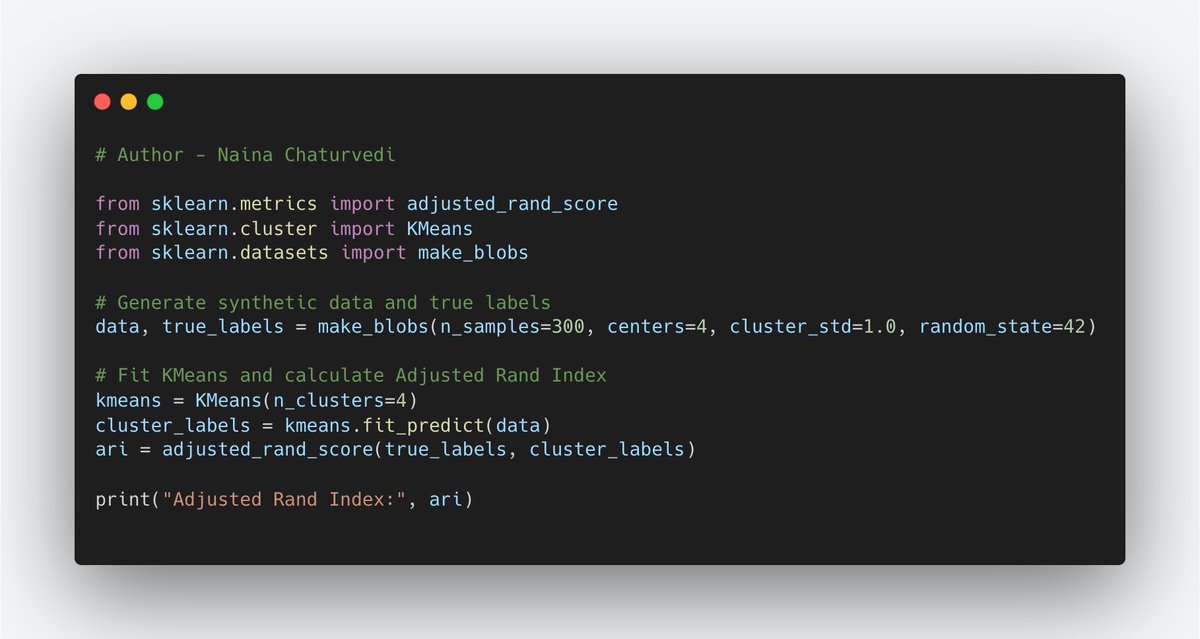
It compares the similarity between true class labels and cluster assignments, considering all pairs of samples. It ranges from -1 to 1, where higher values indicate better agreement between clusters and true labels.
It compares the similarity between true class labels and cluster assignments, considering all pairs of samples. It ranges from -1 to 1, where higher values indicate better agreement between clusters and true labels.
28/ Normalized Mutual Information (NMI):
It measures the mutual information between true class labels and cluster assignments, normalized by the entropy of the two label sets. It ranges from 0 to 1, where higher values indicate better agreement between clusters and true labels.
It measures the mutual information between true class labels and cluster assignments, normalized by the entropy of the two label sets. It ranges from 0 to 1, where higher values indicate better agreement between clusters and true labels.

29/ Clustering Applications -
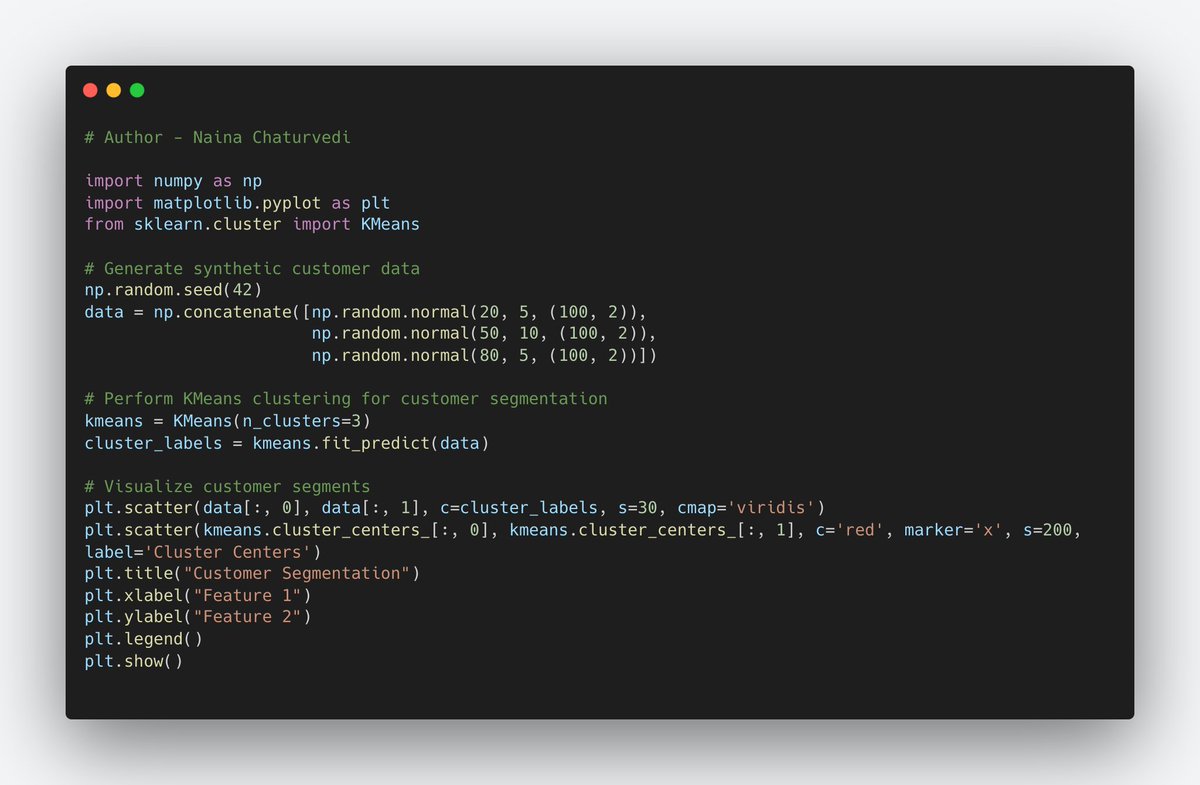
Market Segmentation for Businesses:
It divides customers into groups based on shared characteristics, behaviors, or preferences. This helps businesses tailor their marketing strategies to different customer segments.
Market Segmentation for Businesses:
It divides customers into groups based on shared characteristics, behaviors, or preferences. This helps businesses tailor their marketing strategies to different customer segments.
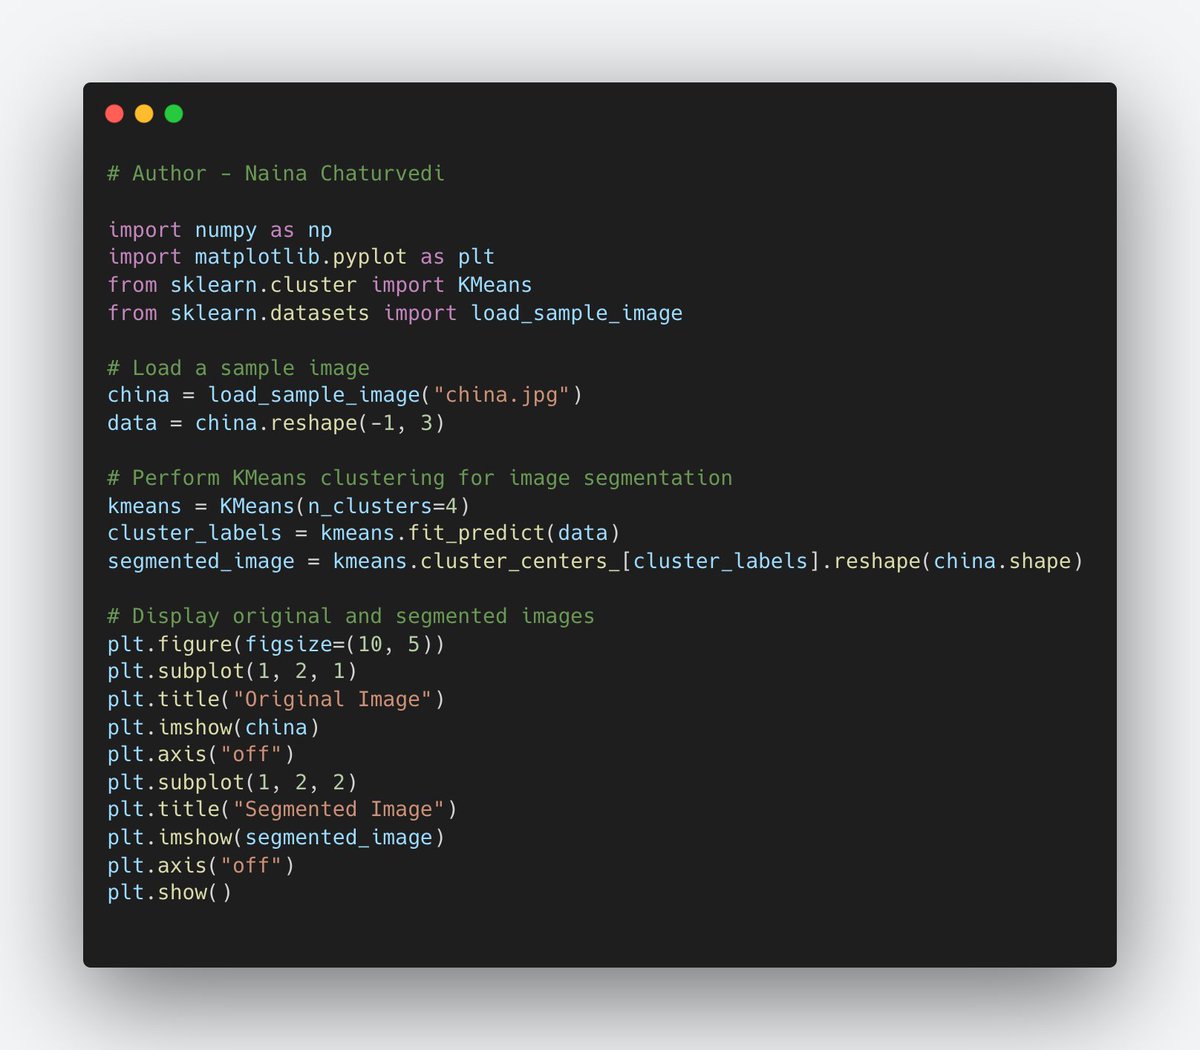
30/ Image Segmentation for Computer Vision:
It divides an image into meaningful regions or objects. It's used in computer vision for tasks like object detection, image editing, and medical imaging.
It divides an image into meaningful regions or objects. It's used in computer vision for tasks like object detection, image editing, and medical imaging.
31/ Social Network Analysis:
It involves studying relationships between individuals in a network. Clustering can help identify groups of individuals with similar interests or connections.
It involves studying relationships between individuals in a network. Clustering can help identify groups of individuals with similar interests or connections.


github.com/Coder-World04/…
GitHub - Coder-World04/Complete-Machine-Learning-: This repository contains everything you need to become proficient in Machine Learning
This repository contains everything you need to become proficient in Machine Learning - GitHub - Cod...

naina0405.substack.com
Ignito | Naina Chaturvedi | Substack
Thousands of subscribers. Data Science, ML, AI and more... Click to read Ignito, by Naina Chaturvedi...
جاري تحميل الاقتراحات...