

The NORMAL DISTRIBUTION is one of the most applicable distribution in STATISTICS and that’s because a lot of variables (IQ scores , weight, height) are normally distributed.
There is a difference between NORMAL and STANDARD NORMAL DISTRIBUTION
Retweet cos… it’s a THREAD 🧵
There is a difference between NORMAL and STANDARD NORMAL DISTRIBUTION
Retweet cos… it’s a THREAD 🧵
Let’s start by understanding what a normal distribution is.
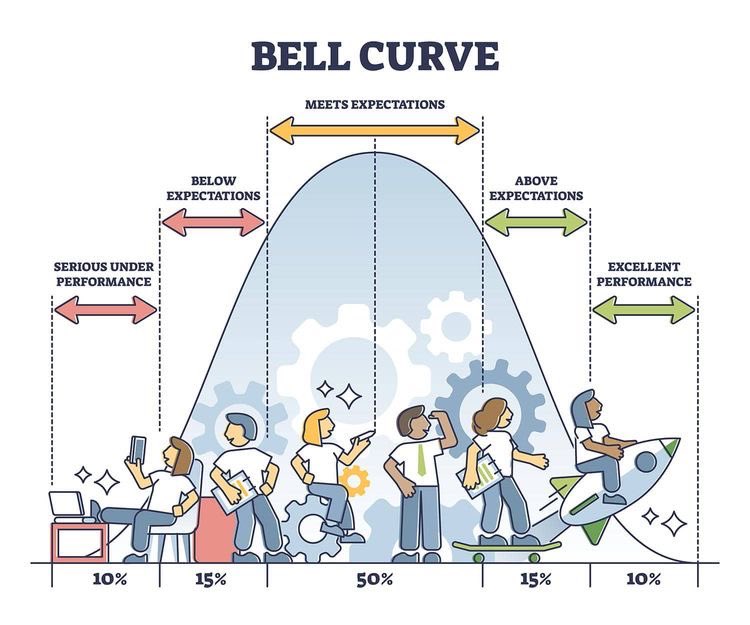
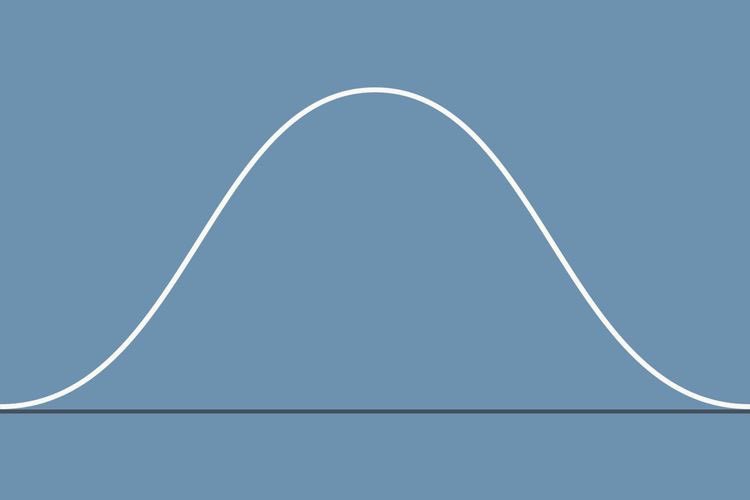
Basically a NORMAL distribution is a type of a continuous probability distribution that is symmetric and have the bell shape.
By symmetric it means if we divide from the center, one half mirror the other..
Basically a NORMAL distribution is a type of a continuous probability distribution that is symmetric and have the bell shape.
By symmetric it means if we divide from the center, one half mirror the other..
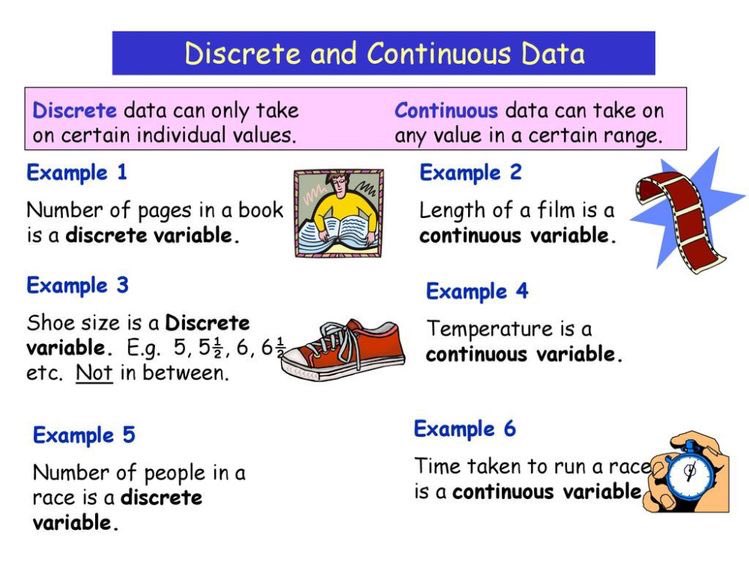
By continuous probability distribution, it means the variables that makes it up are continuous.
A continuous variable is not countable 👎⛔️, rather they are measurable 📏and can take decimal values.
Speed, pressure and height are examples of a continuous variable.
A continuous variable is not countable 👎⛔️, rather they are measurable 📏and can take decimal values.
Speed, pressure and height are examples of a continuous variable.
A normal distribution is defined by 2 details…. The mean (u) and the standard deviation (σ).
The mean determines the center and position of the distribution and the standard deviation determines the spread and width.
For several values of u and σ, we have different shapes 😊
The mean determines the center and position of the distribution and the standard deviation determines the spread and width.
For several values of u and σ, we have different shapes 😊
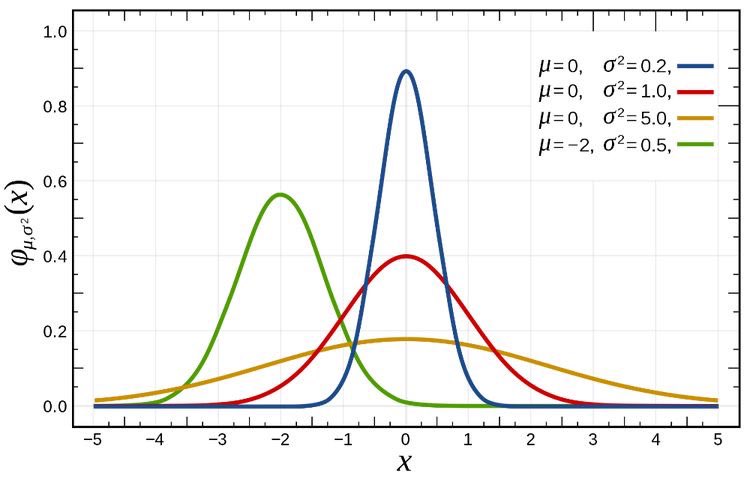
So I’m summary, a normal distribution can have several values of mean and standard deviation and can also have different shapes.
A STANDARD NORMAL DISTRIBUTION is a normal distribution that have a single value of mean, single value of standard deviation and just a single shape.
The mean have a value of 0
The standard deviation have a value of 1
The mean have a value of 0
The standard deviation have a value of 1
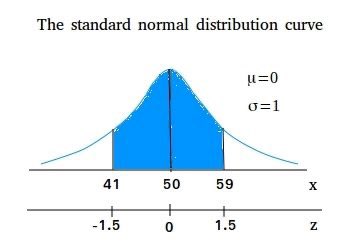
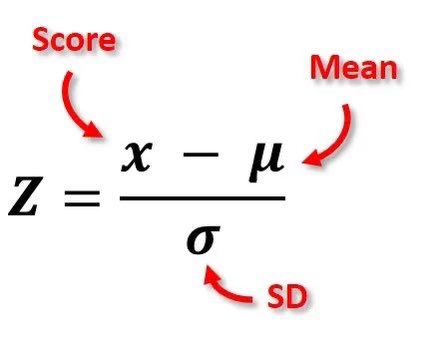
A STANDARD NORMAL DISTRIBUTION has converted all the values (x) of the normal distribution into standardized scores that is called a Z - SCORES.
This transformation is done by using the formulae
Z = x - u / σ
This transformation is done by using the formulae
Z = x - u / σ
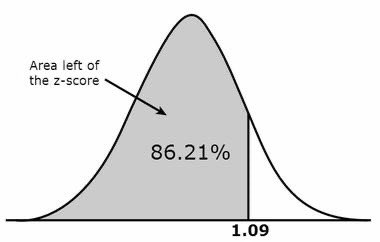
By having z scores instead of x, we can be able to conveniently calculate the area under the curve to the right or left of a z score or between 2 scores.
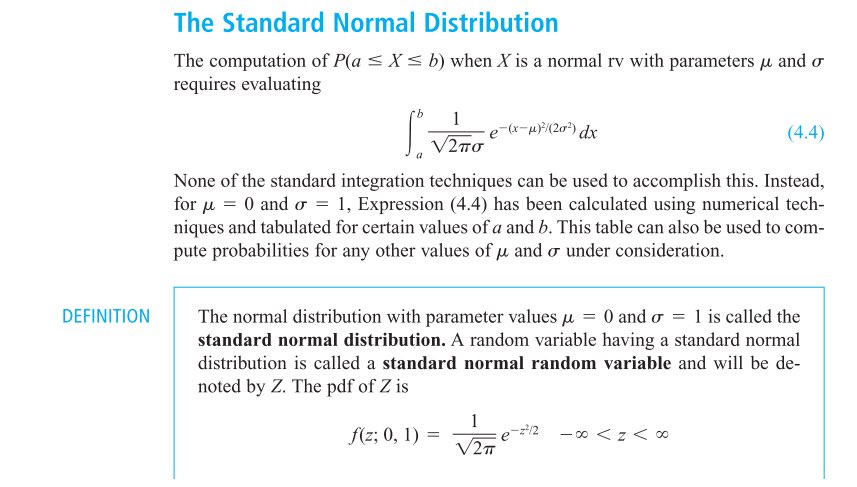
The reason we transform a raw score (x) into a z score is simply because the mathematics that defines a normal distribution is really advanced and complex such that mathematicians had to use approximations (u = 0, σ = 1) and it easier to get area under the curve with z scores.
The normal distribution is one of the most popular and applicable distribution in statistics hence you will meet a lot of variables defined by this distribution a lot of time.
Sometimes you will have to convert other distributions into a normal distribution.
Sometimes you will have to convert other distributions into a normal distribution.
If you want to learn the needed statistics to start your data analysis journey, I have the perfect playlist for you ⬇️
youtube.com
youtube.com
جاري تحميل الاقتراحات...