

🧵 Excited to share some findings from building LIDA - a tool for automatic data exploration, visualization and infographics!
We are only scratching the surface of how LLMs (#chatgpt #gpt4) can revolutionize data visualization.
microsoft.github.io #GenerativeAI
We are only scratching the surface of how LLMs (#chatgpt #gpt4) can revolutionize data visualization.
microsoft.github.io #GenerativeAI

![LIDA [Beta] | LIDA: Automated Visualizations with LLMs](https://pbs.twimg.com/news_img/1653441782879748104/wEcM46vV?format=jpg&name=orig)
2\n How it works
LIDA casts visualization/infographics generation as a multi-stage code generation problem using LLMs. Accomplishes this via a summarizer, goal explorer, vizgenerator and infographics generator modules.
LIDA casts visualization/infographics generation as a multi-stage code generation problem using LLMs. Accomplishes this via a summarizer, goal explorer, vizgenerator and infographics generator modules.
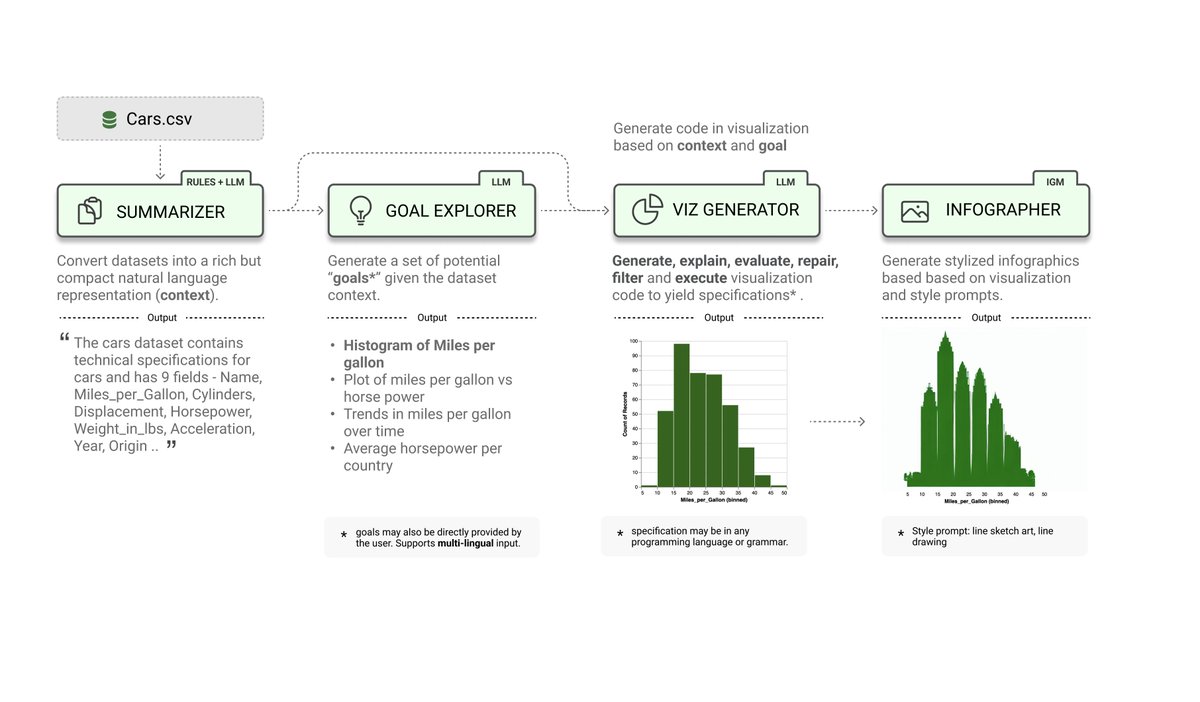
3\n Step 1: Data Summarization
The LLM needs a compact but rich representation of the data as context.
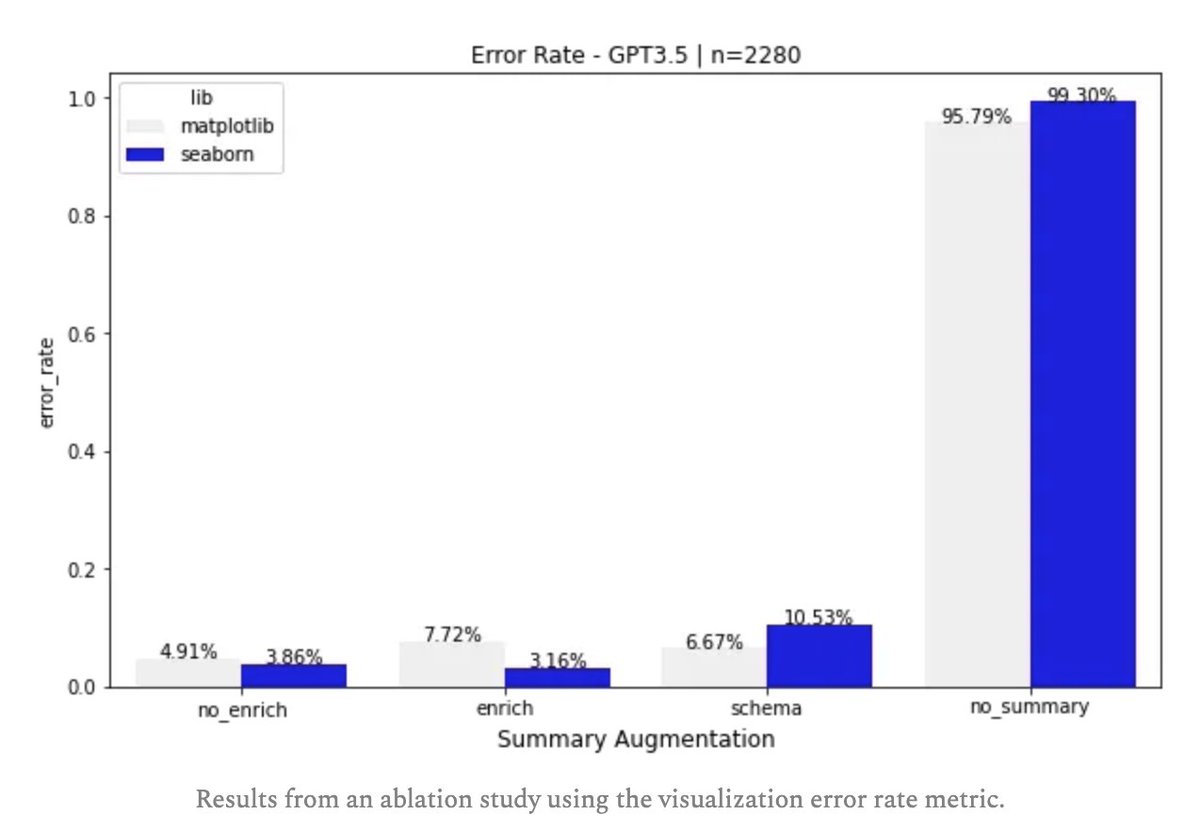
We use rules (col types, properties) + LLM enrichment (col descriptions, semantic type).
Impact: ~7% reduction in visualization error rate.
microsoft.github.io
The LLM needs a compact but rich representation of the data as context.
We use rules (col types, properties) + LLM enrichment (col descriptions, semantic type).
Impact: ~7% reduction in visualization error rate.
microsoft.github.io

![LIDA [Beta] | Gallery](https://pbs.twimg.com/news_img/1650901206234202114/5TFZ1GQU?format=jpg&name=orig)
4\n Step 2: Goal Exploration
With the right data summary, and prompt, LLMs can work really well in generating data-grounded questions, with rationale.
EDA for “free”.
With the right data summary, and prompt, LLMs can work really well in generating data-grounded questions, with rationale.
EDA for “free”.
![This module generates data exploration goals, given the data summary. In our implementation, we express this as a multitask generation problem for an LLM to solve. For each goal, the LLM must generate a question (hypothesis), a visualization that addresses the question and rationale. Requiring the model to produce rationale tends to lead to more meaningful goals.
[Prompt Excerpt: You are a skilled data analyst. Given the data summary provided, generate a set of n goals that fit the data. … Your response must use the following format]](https://pbs.twimg.com/media/FuklRu6aUAA5RF4.jpg)
5\n Step 3: Grammar Agnostic Automated visualization
LLMs are quite adept at writing code and can be tasked to generate visualizations in any language/grammar as long as it can be represented as code. R, Python, C? GGPlot, Seaborn, Matplotlib? All possible.
LLMs are quite adept at writing code and can be tasked to generate visualizations in any language/grammar as long as it can be represented as code. R, Python, C? GGPlot, Seaborn, Matplotlib? All possible.
6\n Step 4: Infographic Generation
Takes raster images provided by the LIDA pipeline and generates stylized "data-faithful" infographics. Many applications in personalization, data story generation.
Takes raster images provided by the LIDA pipeline and generates stylized "data-faithful" infographics. Many applications in personalization, data story generation.
![This module is tasked with generating stylized graphics based on output from the VIZGENERATOR module. It implements a library of visual styles described in natural language that are applied directly to visualization images. Note that the style library is editable by the user. These styles are applied in generating infographics using the text-conditioned image-to-image generation capabilities of diffusion models [5] implemented using the Peacasso library api. An optional post processing step is then applied to improve the resulting image (e.g., replace axis with correct values from visualization, removing grid lines, and sharpening edges).](https://pbs.twimg.com/media/FuklbJfaEAAfIOF.jpg)
7\n VizOps - Visualization Explanation and Accessibility
When we represent visualizations as code, we can apply many operations on this representation including - natural language based refinement, explanation (accessibility descriptions), self-evaluation.
When we represent visualizations as code, we can apply many operations on this representation including - natural language based refinement, explanation (accessibility descriptions), self-evaluation.

8\n VizOps - Self-Evaluation and Automatic Repair
Do LLMs encode visualization best practices? Are they calibrated to self evaluate across multiple visualization quality dimensions? GPT-4 shows very compelling results! Best of all, we can self-evaluate and self repair.
Do LLMs encode visualization best practices? Are they calibrated to self evaluate across multiple visualization quality dimensions? GPT-4 shows very compelling results! Best of all, we can self-evaluate and self repair.

9\n Evaluation ..
Wait up .. how do we evaluate LIDA? We are currently using two metrics - Visualization error rates (VER) and self-evaluated visualization quality (SEVQ) metric (via GPT-4).
VER has been critical in informing prompt/scaffold design.
Wait up .. how do we evaluate LIDA? We are currently using two metrics - Visualization error rates (VER) and self-evaluated visualization quality (SEVQ) metric (via GPT-4).
VER has been critical in informing prompt/scaffold design.
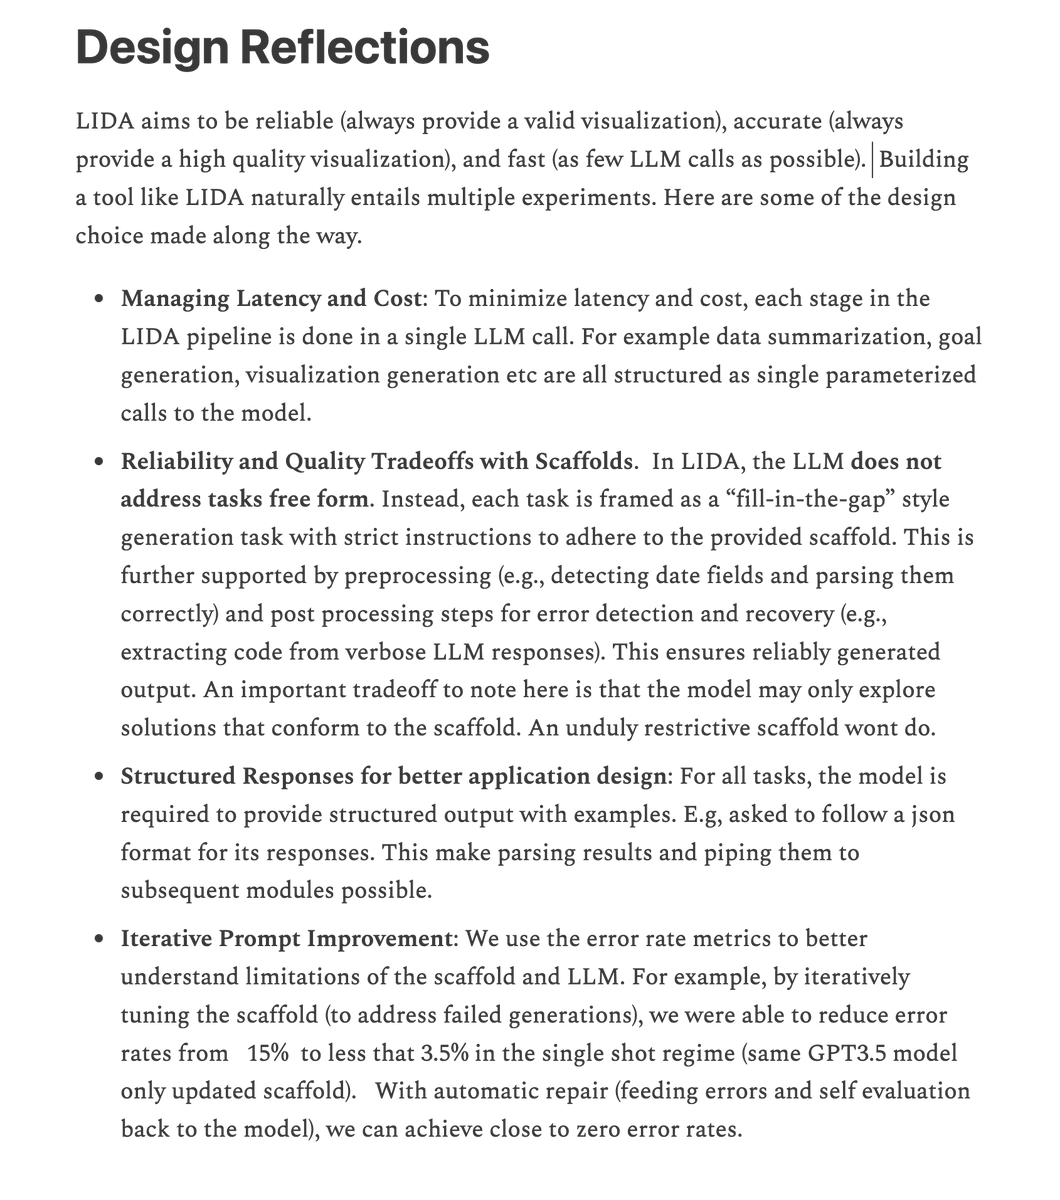
10\n Design Reflections
LIDA aims to be reliable (always provide a valid visualization), accurate (always provide a high quality visualization), and fast (as few LLM calls as possible).
While this is constantly being improved, the scaffolds and prompt engineering is critical
LIDA aims to be reliable (always provide a valid visualization), accurate (always provide a high quality visualization), and fast (as few LLM calls as possible).
While this is constantly being improved, the scaffolds and prompt engineering is critical
10\n Learn more in the paper.
LIDA: A Tool for Automatic Generation of Grammar-Agnostic Visualizations and Infographics using Large Language Models
arxiv.org
LIDA: A Tool for Automatic Generation of Grammar-Agnostic Visualizations and Infographics using Large Language Models
arxiv.org

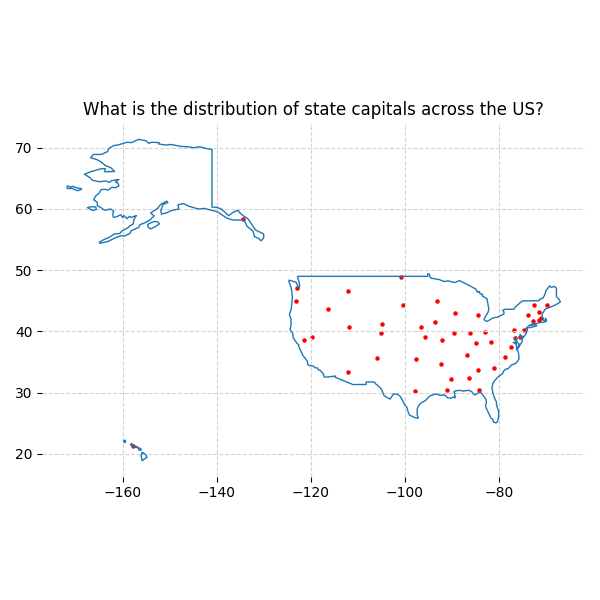
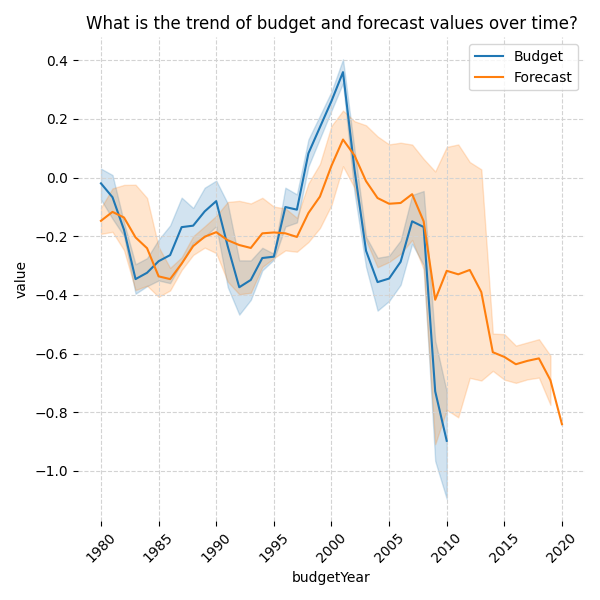
11\n Gallery
A gallery of example visualization goals and visualizations created with LIDA microsoft.github.io
A gallery of example visualization goals and visualizations created with LIDA microsoft.github.io
![LIDA [Beta] | Gallery](https://pbs.twimg.com/news_img/1650901220012494849/qa8_Bqn_?format=jpg&name=orig)
جاري تحميل الاقتراحات...