

Tough times call for tougher measures.
Here's my take on relative strength using a simple moving average, some cricketing analogies (Sachin the index vs Virat the stock 😎) & a Tradingview script!
A long thread 🧵 begins:
Here's my take on relative strength using a simple moving average, some cricketing analogies (Sachin the index vs Virat the stock 😎) & a Tradingview script!
A long thread 🧵 begins:
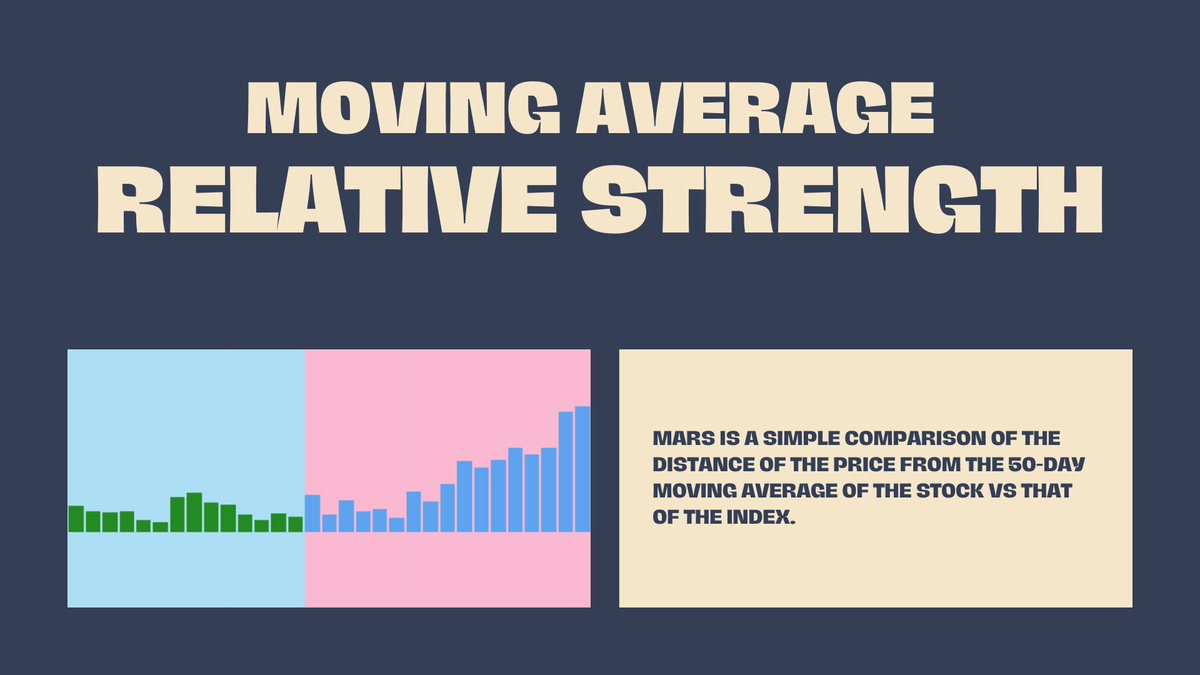
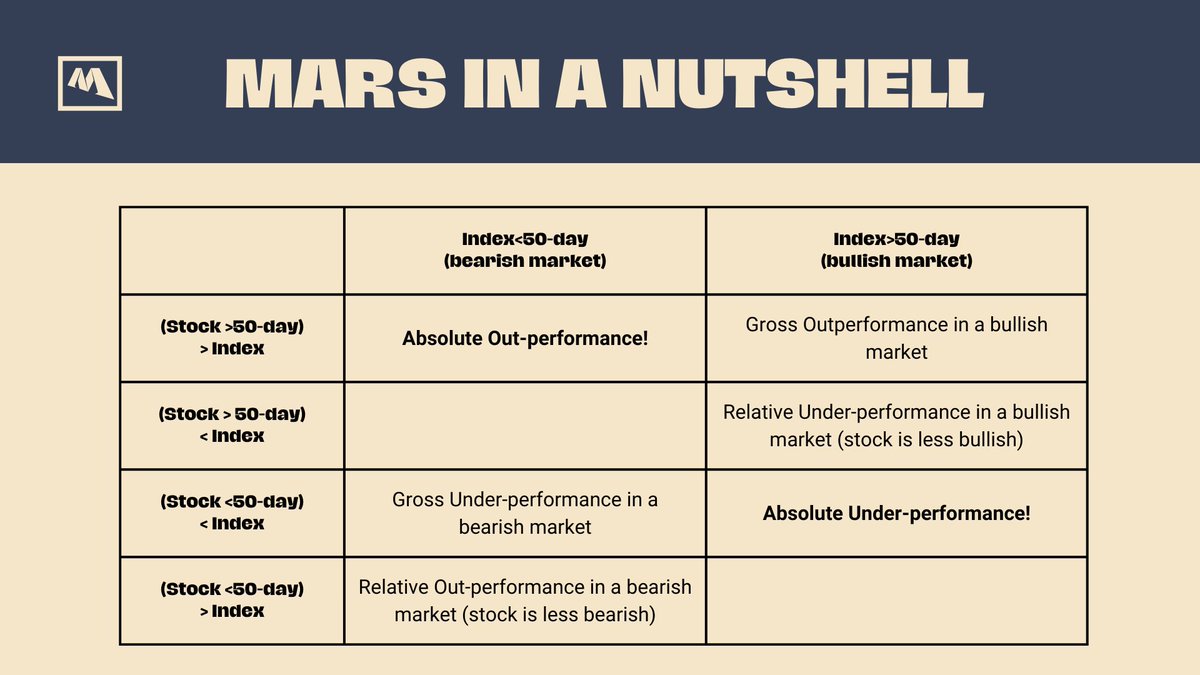
What is MARS?
MARS stands for Moving Average Relative Strength.
We compare distance from 50-day moving average of the stock vs that of the index. Whomsoever of the 2 has a greater value is stronger.
The length of the moving average is customisable as per your time-horizon.
MARS stands for Moving Average Relative Strength.
We compare distance from 50-day moving average of the stock vs that of the index. Whomsoever of the 2 has a greater value is stronger.
The length of the moving average is customisable as per your time-horizon.
Background color indicates the index being above or below its moving average.
- Blue: index above its MA
- Pink: index below its MA
Histogram indicates whether the stock is under-performing or out-performing the index.
- Up-bars: out-performing
- Down-bars: under-performing
- Blue: index above its MA
- Pink: index below its MA
Histogram indicates whether the stock is under-performing or out-performing the index.
- Up-bars: out-performing
- Down-bars: under-performing
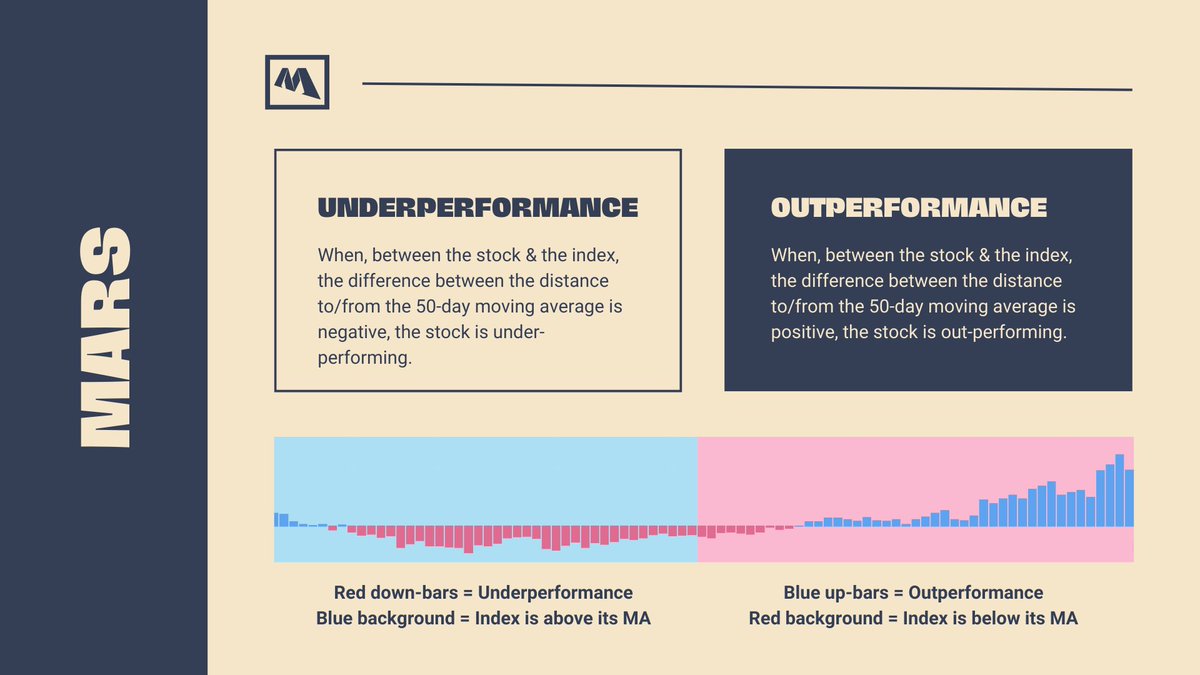
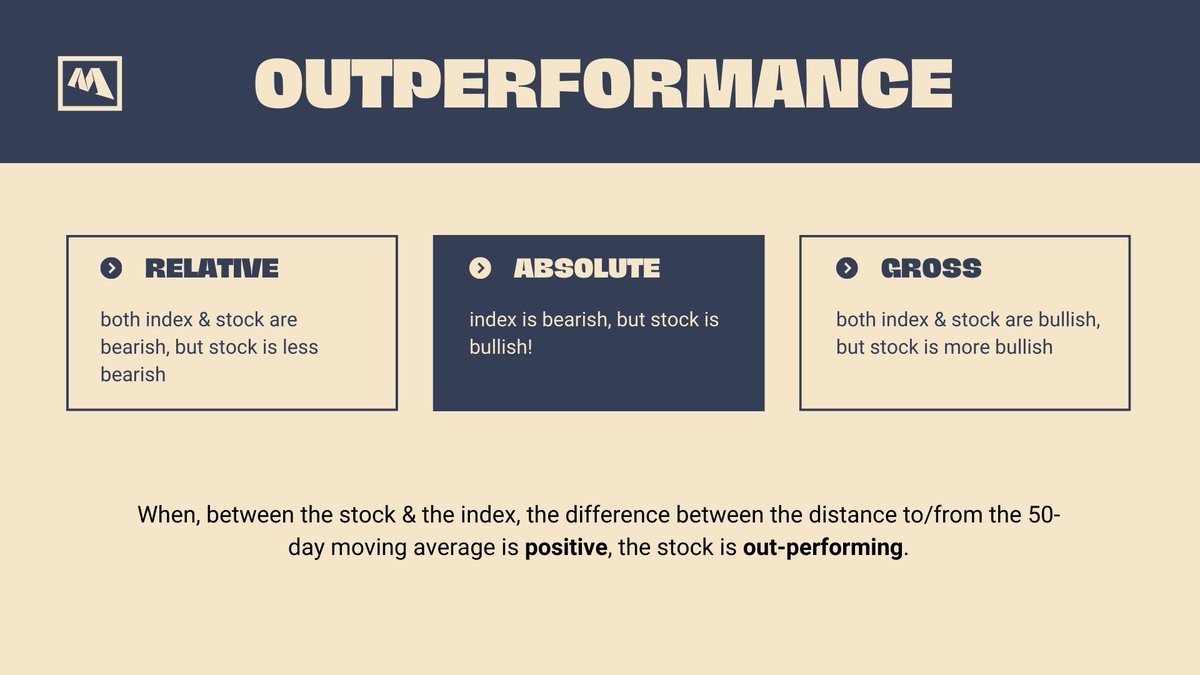
Outperformance
When, between the stock & the index, the difference between the distance to/from the 50-day moving average is a positive value, the stock is out-performing.
This outperformance can be of 3 types:
⦿ Relative
⦿ Absolute
⦿ Gross
When, between the stock & the index, the difference between the distance to/from the 50-day moving average is a positive value, the stock is out-performing.
This outperformance can be of 3 types:
⦿ Relative
⦿ Absolute
⦿ Gross
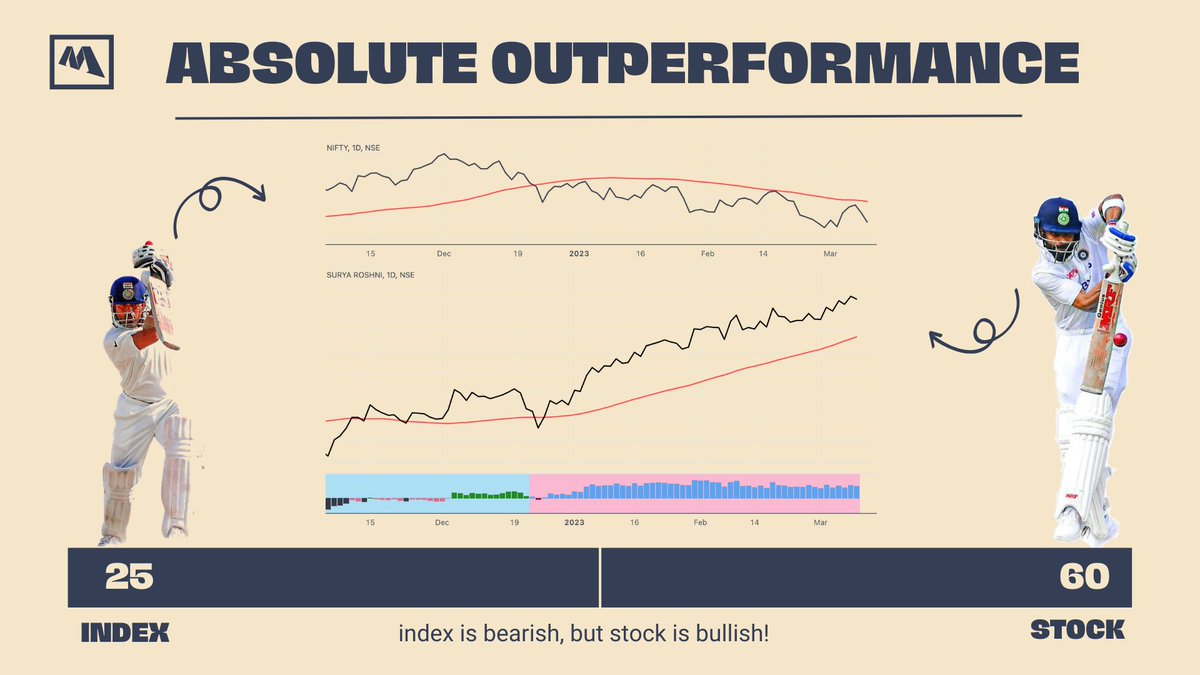
Absolute Outperformance
⦿ Batting conditions are tough. Sachin has made just 25 runs (bearish), but Kohli has easily made 60 runs (bullish).
⦿ The index is bearish, but the stock is bullish.
⦿ The script prints blue up-bars on a pink background.
⦿ Batting conditions are tough. Sachin has made just 25 runs (bearish), but Kohli has easily made 60 runs (bullish).
⦿ The index is bearish, but the stock is bullish.
⦿ The script prints blue up-bars on a pink background.
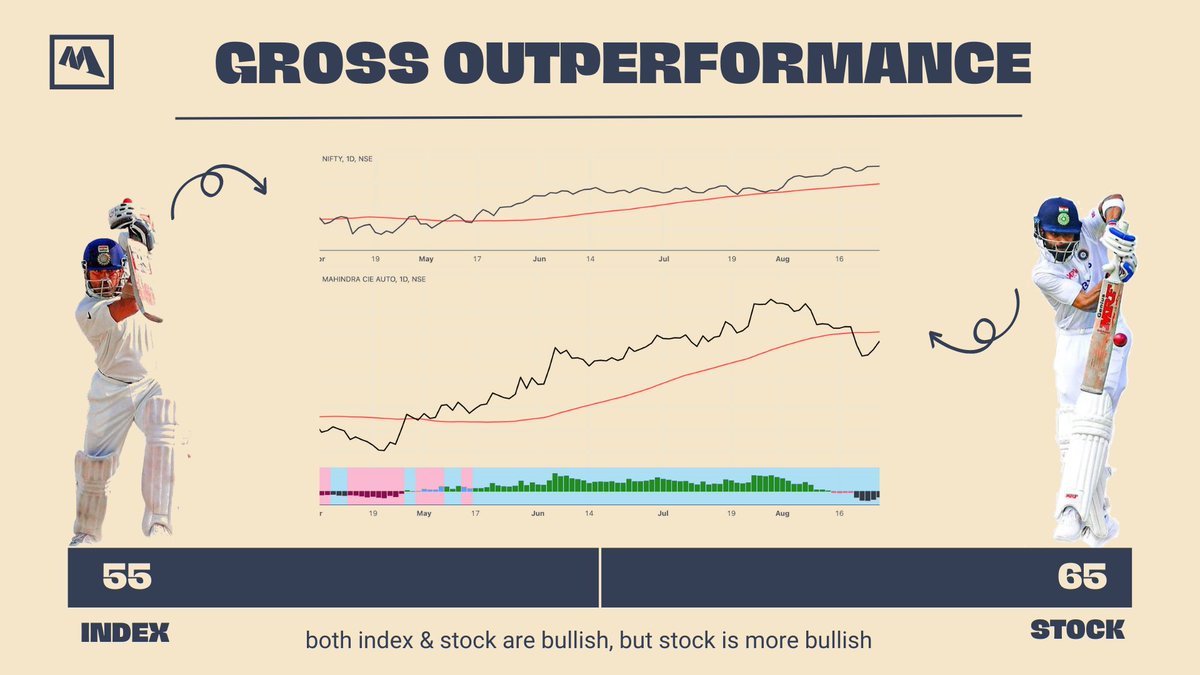
Gross Outperformance
⦿ Batting conditions are easy. Sachin has made 55 runs (bullish), but Kohli has made 65 runs (bullish).
⦿ Both index & stock are bullish, but stock is more bullish
⦿ The script prints green up-bars on a blue background.
⦿ Batting conditions are easy. Sachin has made 55 runs (bullish), but Kohli has made 65 runs (bullish).
⦿ Both index & stock are bullish, but stock is more bullish
⦿ The script prints green up-bars on a blue background.
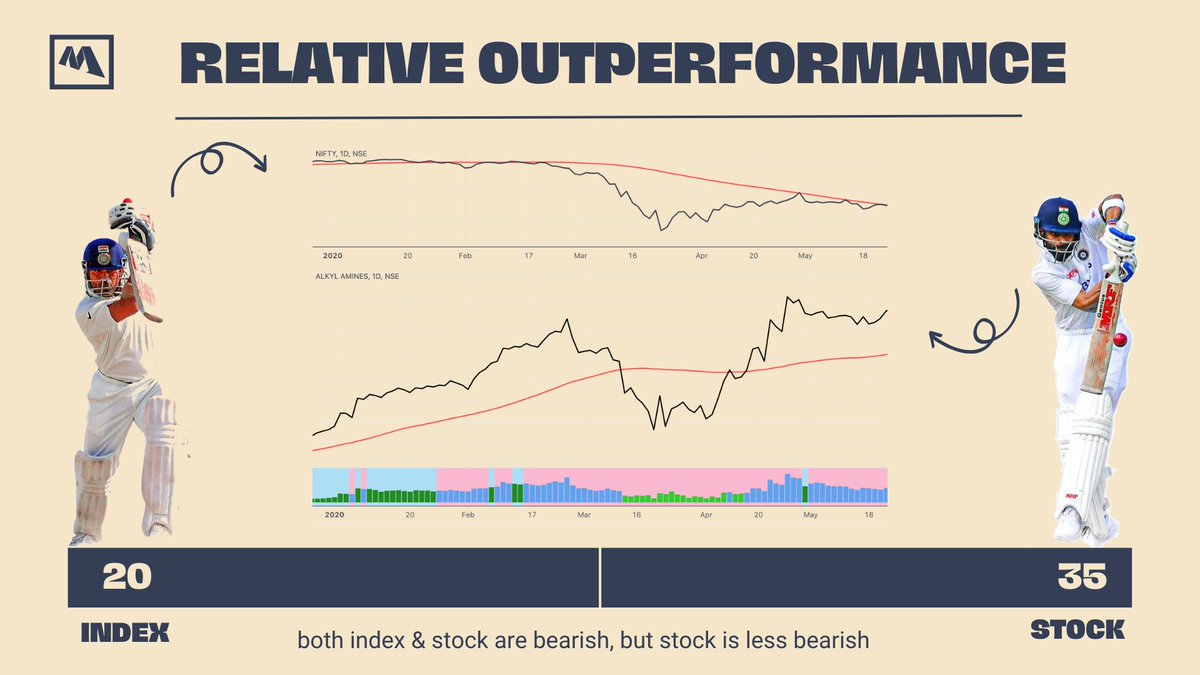
Relative Outperformance
⦿ Batting conditions are tough. Sachin has made 20 runs (bearish), but Kohli has made 35 runs (less bearish).
⦿ Both index & stock are bearish, but stock is less bearish
⦿ The script prints light green up-bars on a pink background.
⦿ Batting conditions are tough. Sachin has made 20 runs (bearish), but Kohli has made 35 runs (less bearish).
⦿ Both index & stock are bearish, but stock is less bearish
⦿ The script prints light green up-bars on a pink background.
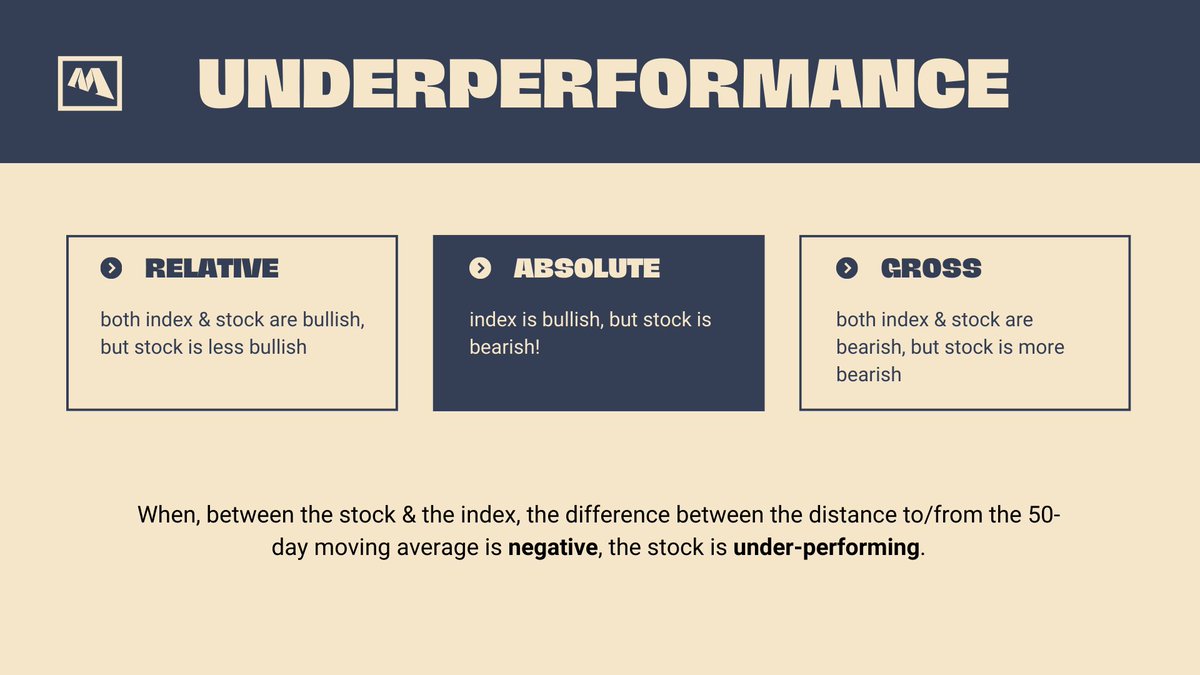
Underperformance
When, between the stock & the index, the difference between the distance to/from the 50-day moving average is a negative value, the stock is under-performing.
This underperformance can be of 3 types:
⦿ Relative
⦿ Absolute
⦿ Gross
When, between the stock & the index, the difference between the distance to/from the 50-day moving average is a negative value, the stock is under-performing.
This underperformance can be of 3 types:
⦿ Relative
⦿ Absolute
⦿ Gross
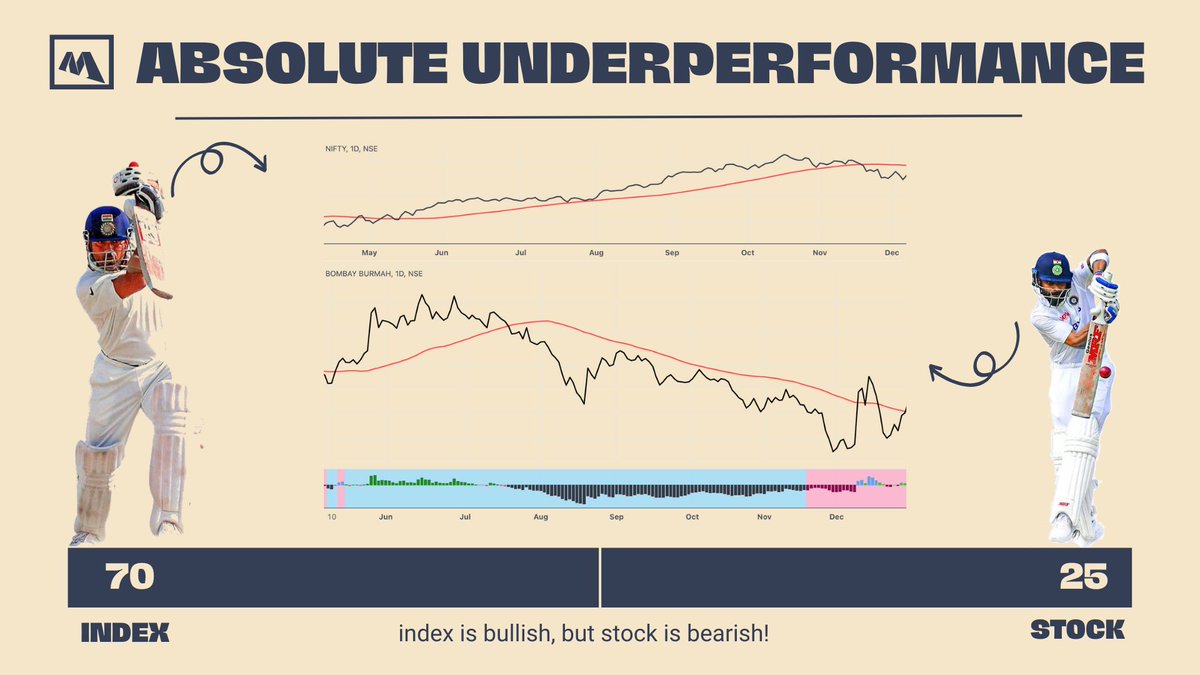
Absolute Underperformance
⦿ Batting conditions are easy. Sachin has already made 70 runs (bullish), but Kohli has only made 25 runs (bearish).
⦿ The index is bullish, but the stock is bearish.
⦿ The script prints black down-bars on a blue background.
⦿ Batting conditions are easy. Sachin has already made 70 runs (bullish), but Kohli has only made 25 runs (bearish).
⦿ The index is bullish, but the stock is bearish.
⦿ The script prints black down-bars on a blue background.
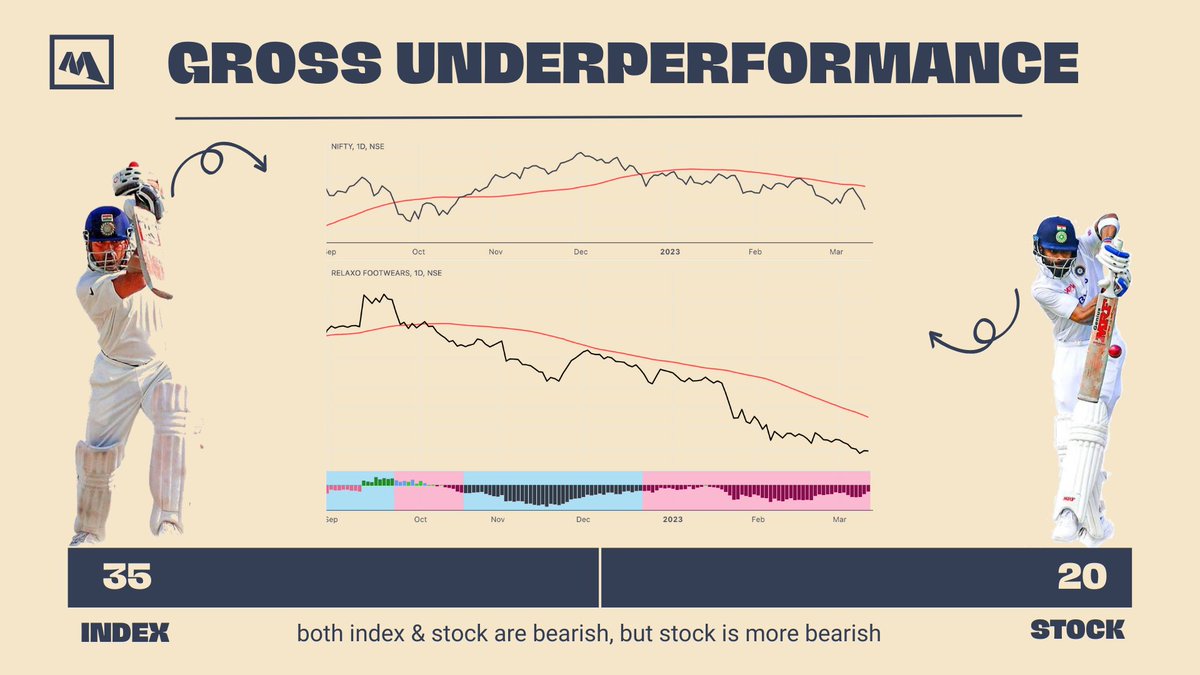
Gross Underperformance
⦿ Batting conditions are tough. Sachin has made 35 runs (bearish), but Kohli has made only 20 runs (more bearish).
⦿ Both index & stock are bearish, but stock is more bearish
⦿ The script prints dark red down-bars on a pink background.
⦿ Batting conditions are tough. Sachin has made 35 runs (bearish), but Kohli has made only 20 runs (more bearish).
⦿ Both index & stock are bearish, but stock is more bearish
⦿ The script prints dark red down-bars on a pink background.
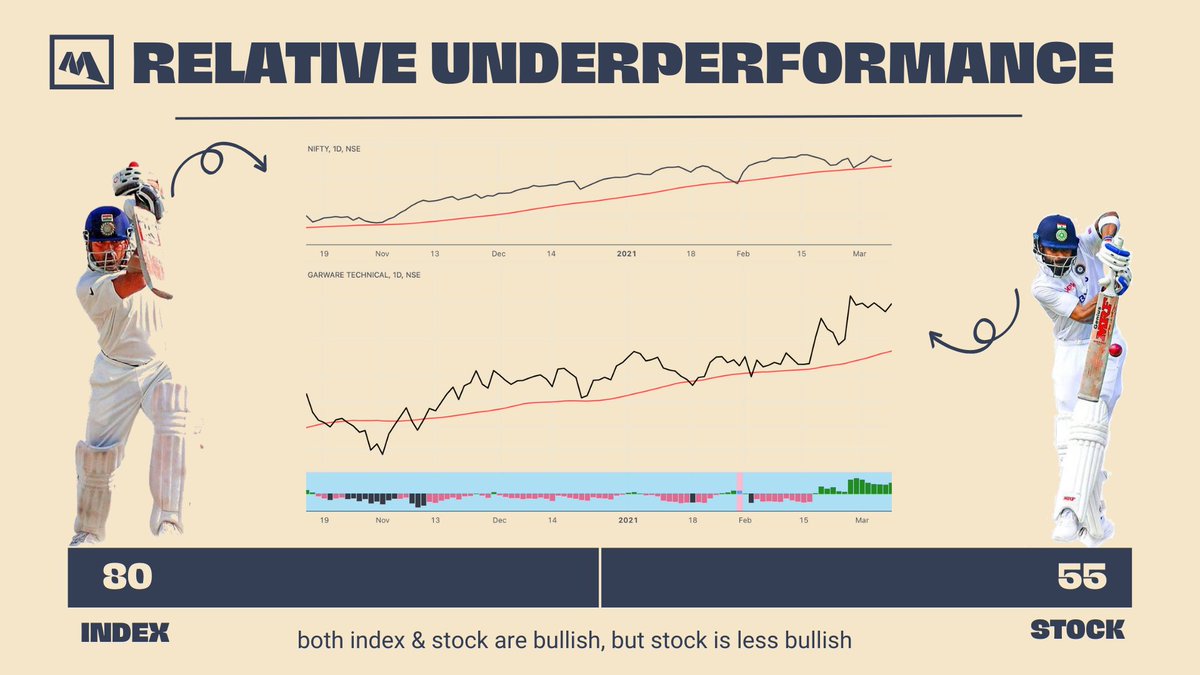
Relative Underperformance
⦿ Batting conditions are easy. Sachin has made 80 runs (bullish), but Kohli has made 55 runs (less bullish).
⦿ Both index & stock are bullish, but stock is less bullish
⦿ The script prints light red down-bars on a blue background.
⦿ Batting conditions are easy. Sachin has made 80 runs (bullish), but Kohli has made 55 runs (less bullish).
⦿ Both index & stock are bullish, but stock is less bullish
⦿ The script prints light red down-bars on a blue background.
In a nutshell, we would love Absolute outperformance, & totally stay away from absolute under-performance.
In the event of the script getting taken down from Tradingview, here is the link to the source code of the script:
shared.snipper.app
shared.snipper.app
That’s all, guys! If you'd like to read this as a blog post, find it here:
world.hey.com
world.hey.com

جاري تحميل الاقتراحات...