

1/ 🧵 THE HIDDEN SECRET OF CHARTS - ORDERBLOCKS 🏅
Have you ever heard of these mystical OBs yet and still struggle with what they really are or how to effectively use them in the charts?
In this thread, we gonna look in-depth into what they are and how to use them
👇👇👇
Have you ever heard of these mystical OBs yet and still struggle with what they really are or how to effectively use them in the charts?
In this thread, we gonna look in-depth into what they are and how to use them
👇👇👇

2/ An Orderblock (OB) was widely introduced by an (in)famous trader ICT and through the years its concept has spread across the Crypto Twitter like a wildfire.
Nowadays they are being used by many traders on the platform in various ways.
Nowadays they are being used by many traders on the platform in various ways.
3/ So what is it?
Sounds complicated but in its basic form isn't anything else but a Block of many Orders accumulated in a tight place
This OB is then a visual representation of a place where a lot of buying & selling took place
Its also heavily used by volume profile traders
Sounds complicated but in its basic form isn't anything else but a Block of many Orders accumulated in a tight place
This OB is then a visual representation of a place where a lot of buying & selling took place
Its also heavily used by volume profile traders

4/ A bullish OB is a down candle(s) in a bullish trend
A bearish OB is an up candle(s) in a bearish trend
OB is measured from the wick high to the wick low with the majority of the volume between Open & Close
To understand OHLC more 👇
A bearish OB is an up candle(s) in a bearish trend
OB is measured from the wick high to the wick low with the majority of the volume between Open & Close
To understand OHLC more 👇
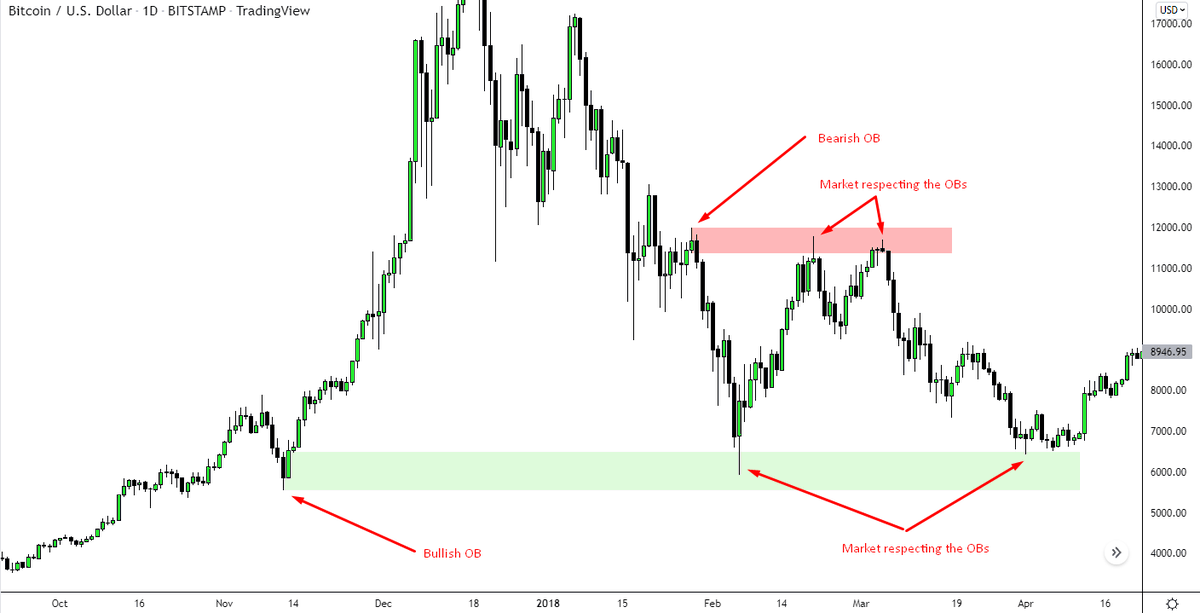
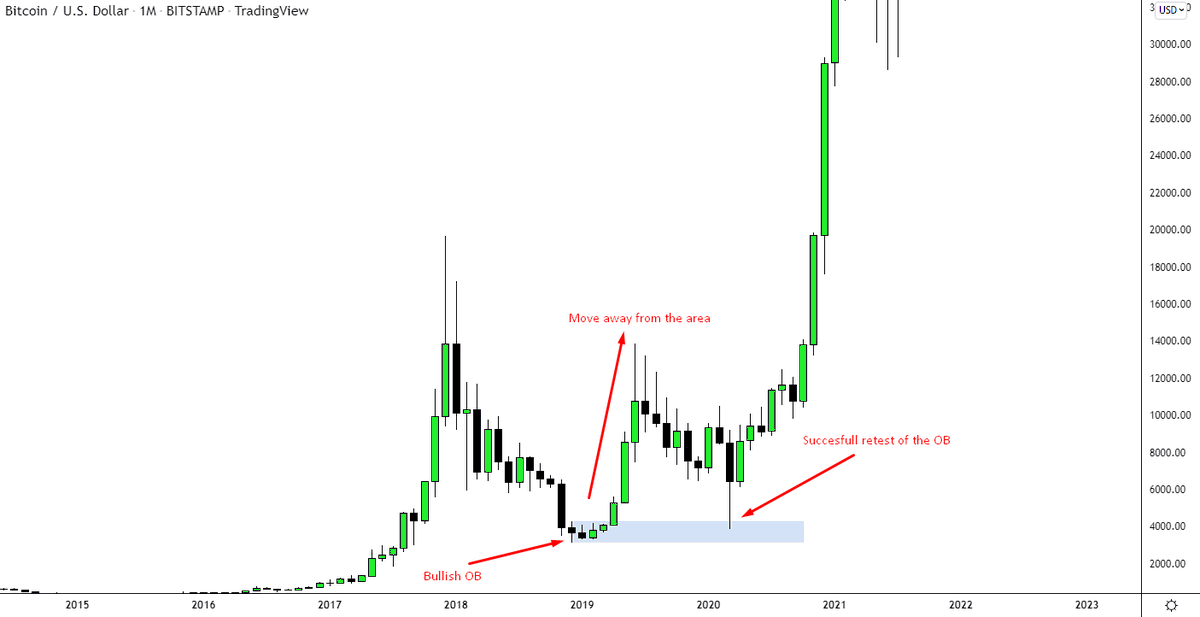
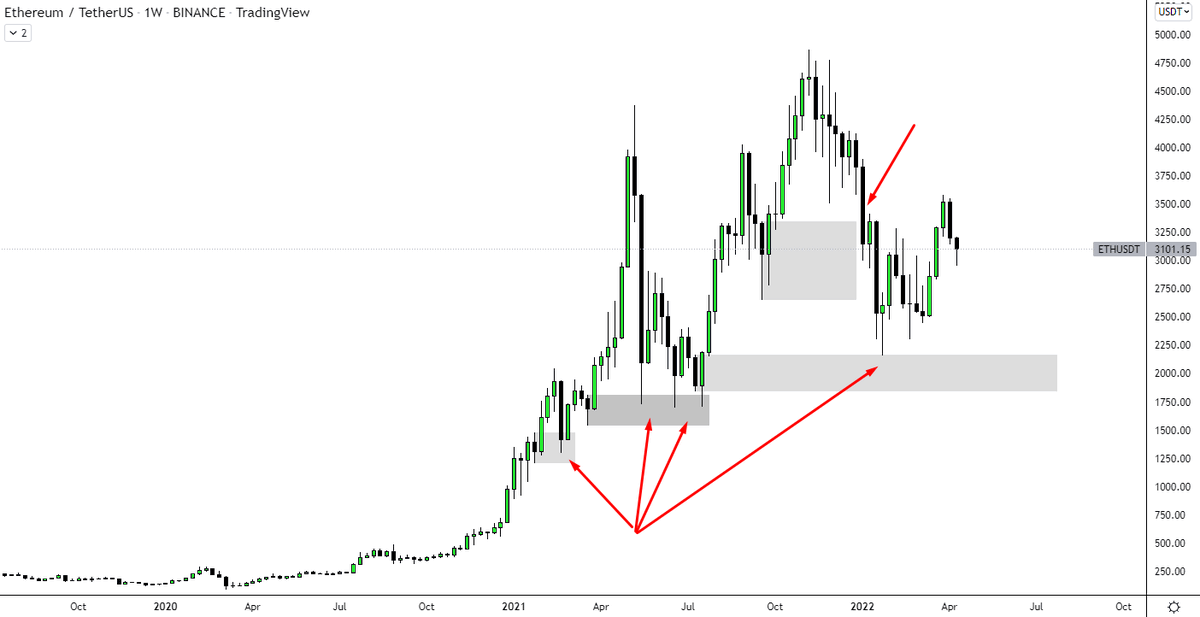
5/ So why does the market respect these areas so well?
Because these OBs were the origin of the move that took the market away from the area of high volume.
It is then being retested to test the health of the trend and if the participants are still willing to buy at that level
Because these OBs were the origin of the move that took the market away from the area of high volume.
It is then being retested to test the health of the trend and if the participants are still willing to buy at that level
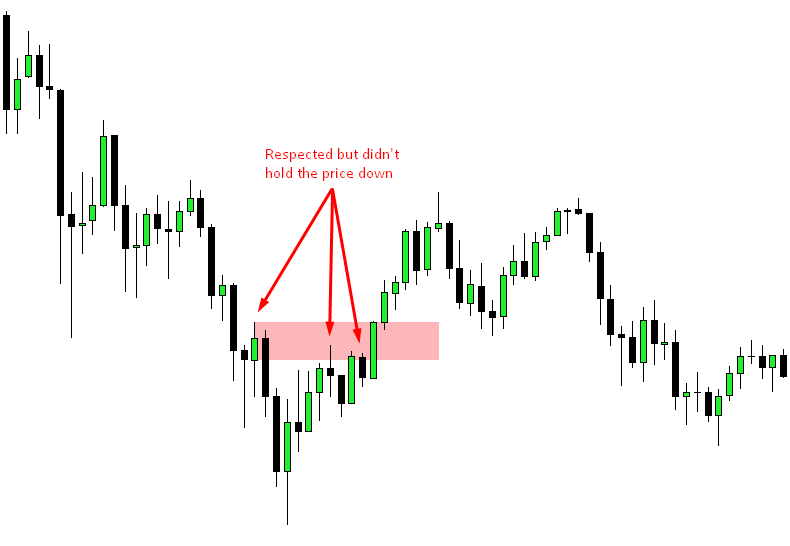
6/ While every up candle in a bearish trend is an OB (Block of Orders), not every up candle is gonna hold much relevance and hold the price. Although it can.
This is where most people trying to understand OBs make mistakes.
We are looking for the ORIGIN of the moves/swings.
This is where most people trying to understand OBs make mistakes.
We are looking for the ORIGIN of the moves/swings.
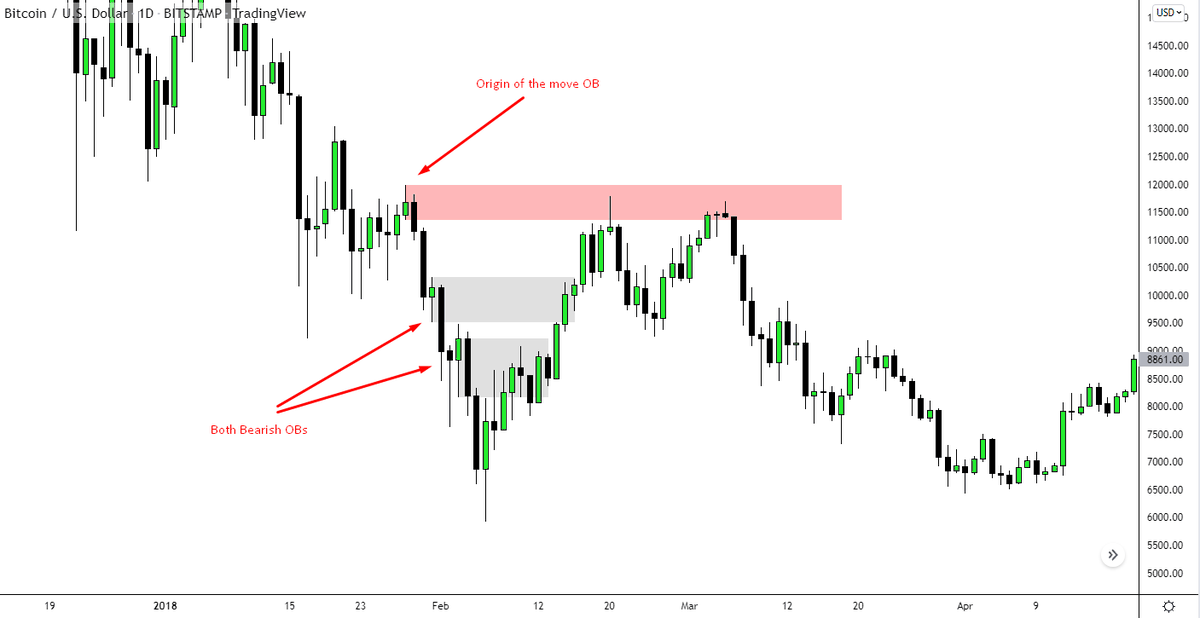
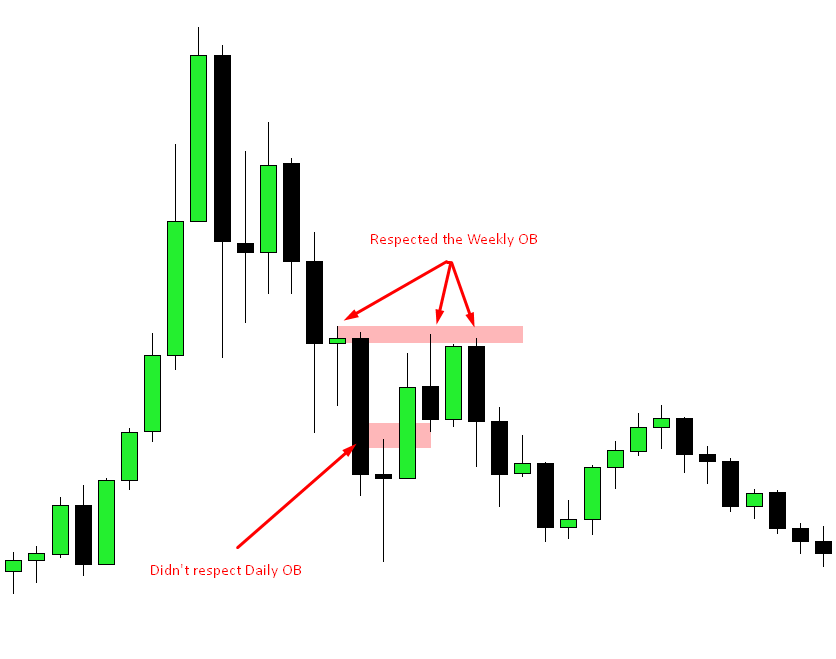
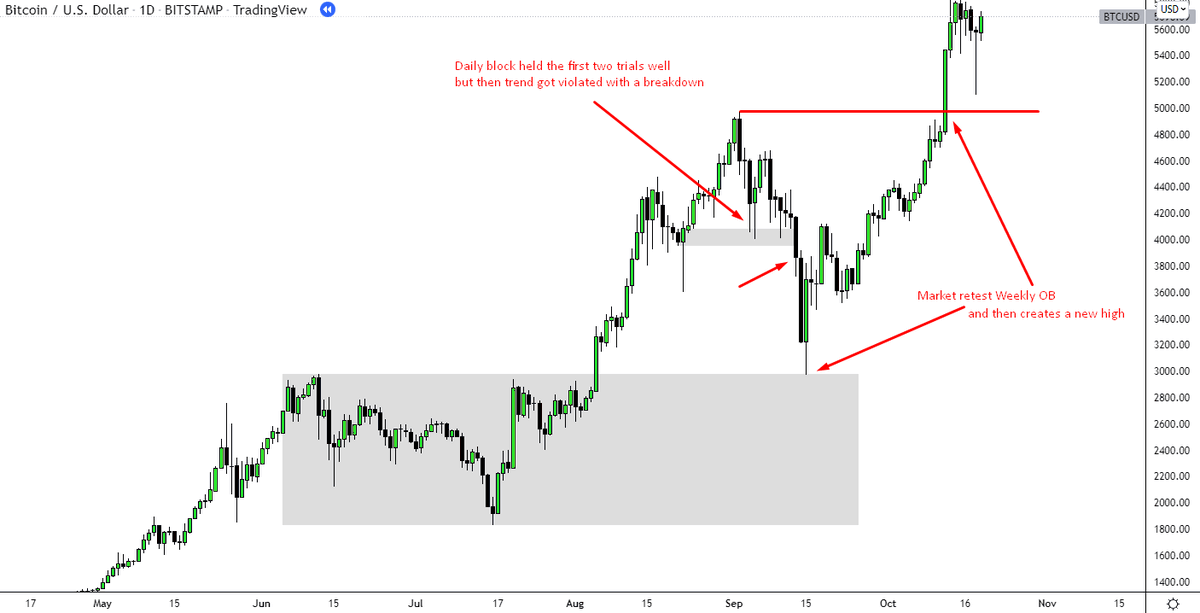
7/ We must also understand the importance of TFs.
Each TF is gonna have its OBs and on each they are important but obviously the higher the timeframe the higher the relevance.
Mostly, when OB on one TF isn't respected, the market wants to retest OB from a higher TF
Each TF is gonna have its OBs and on each they are important but obviously the higher the timeframe the higher the relevance.
Mostly, when OB on one TF isn't respected, the market wants to retest OB from a higher TF
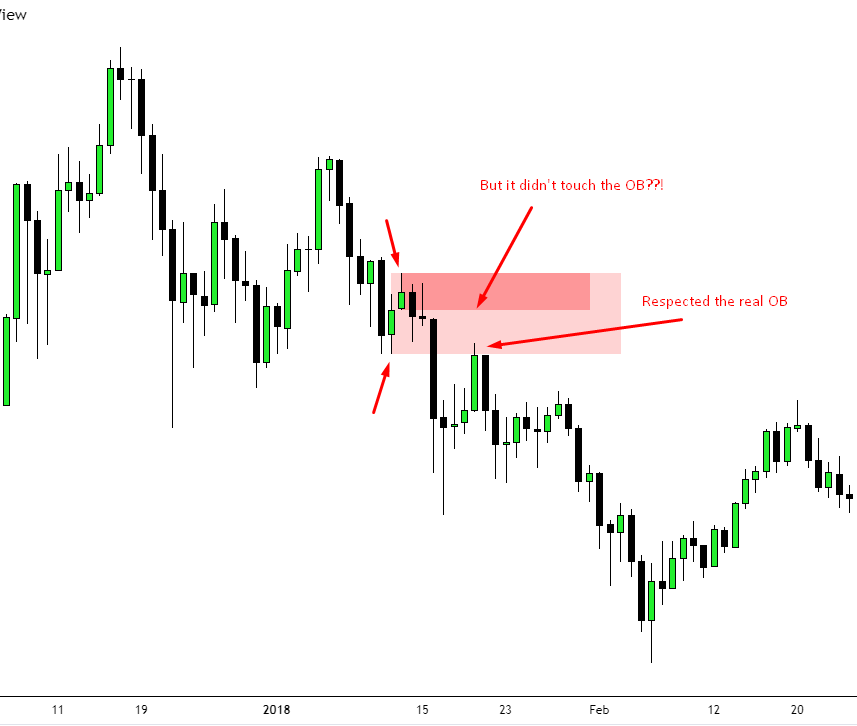
8/ Another important note to understand Orderblocks properly is that price tends to retest the last candle that was the origin of the move, just not always.
The OB is considered to start with the first up candle and ends with the last one.
The OB is considered to start with the first up candle and ends with the last one.
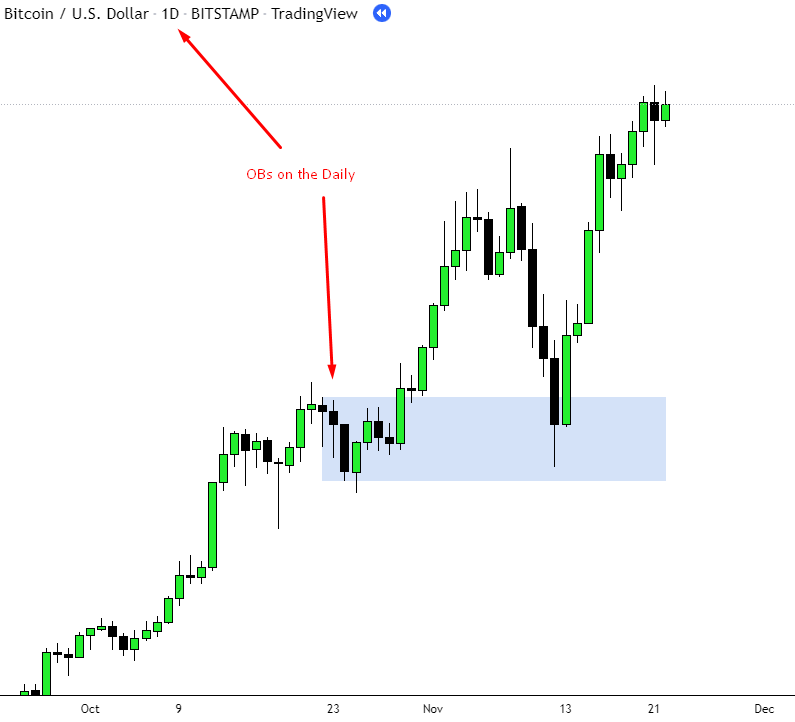
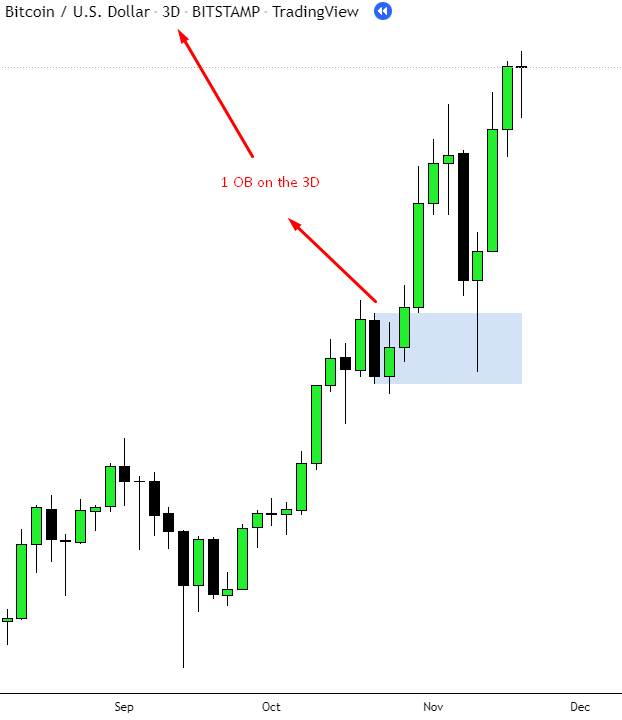
9/ A good hack to that problem is sometimes going to higher TF that shrinks the multiple candles into one candle that is clearly visible.
Doesn't work always so keep in mind to keep on switching between timeframes
Doesn't work always so keep in mind to keep on switching between timeframes
10/ Many traders using OBs also make the mistake that they think the market has to come back and retest every OB in the chart. It doesn't nor will it.
A new OB in a bullish trend is established with a new swing high.
To understand swings:
A new OB in a bullish trend is established with a new swing high.
To understand swings:
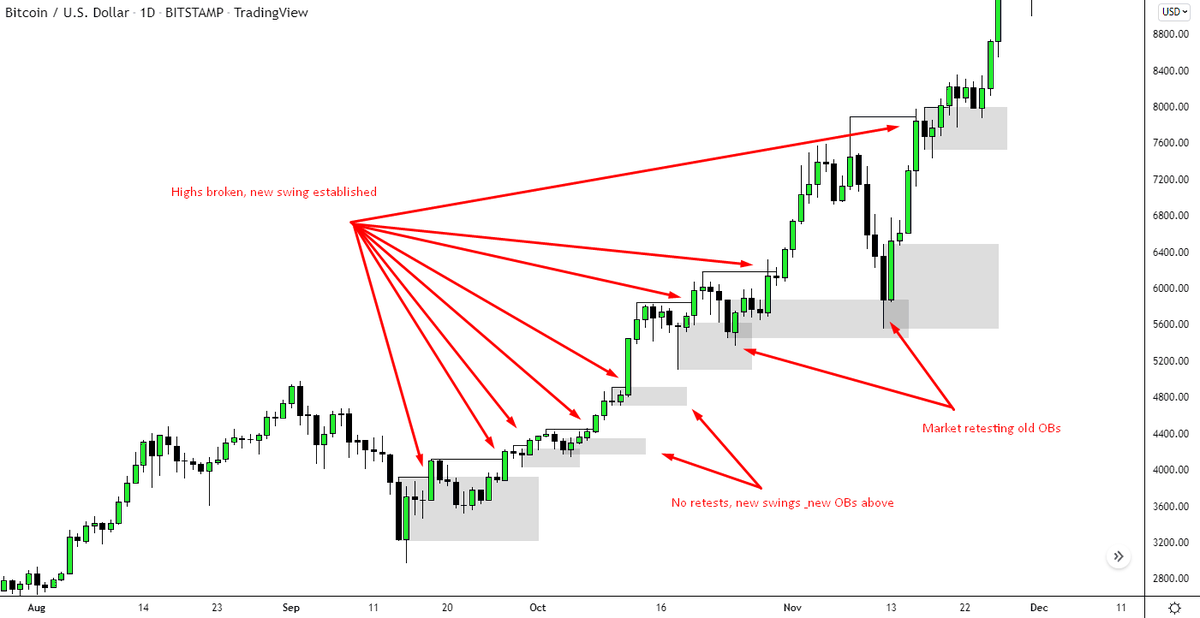
11/ And until one of the OBs on the given TF is broken the trend remains healthy.
Once one gets broken you go back to lesson 7) to higher TF and wait for the retest there or for the market to create a new swing high.
Once one gets broken you go back to lesson 7) to higher TF and wait for the retest there or for the market to create a new swing high.
12/ Just like anything in trading it has its strength & weaknesses
OBs are a super powerful tool in a trending market and not so good one in a ranging market.
To know if you are in a trend or not you can use EMAs as a great tool:
OBs are a super powerful tool in a trending market and not so good one in a ranging market.
To know if you are in a trend or not you can use EMAs as a great tool:
13/ So as you can see OBs are a powerful tool that can be implemented relatively easily.
Even for the people that are vastly using Fundamental analysis for their investments, these areas can be great levels to place your bids.
The important thing is to combine the things above
Even for the people that are vastly using Fundamental analysis for their investments, these areas can be great levels to place your bids.
The important thing is to combine the things above
14/ Thank you for taking the time to read this! 🙌 I wanted to keep it short but EZ to learn
I highly appreciate it if you like and RT this thread 🧵
Help out a brother or sister struggling with this & share it with them
Follow me if you'd like to see more threads like this ✅
I highly appreciate it if you like and RT this thread 🧵
Help out a brother or sister struggling with this & share it with them
Follow me if you'd like to see more threads like this ✅

جاري تحميل الاقتراحات...