

A Beginner's Guide to Technical Analysis. (PART 3)📉
In the previous parts, I taught how to identify trends and interprete Candlesticks, in this part I'll be teaching you how to enter and exit trades using "Support and Resistance".
A #Thread.
RETWEET for others to learn.🙂🔥
In the previous parts, I taught how to identify trends and interprete Candlesticks, in this part I'll be teaching you how to enter and exit trades using "Support and Resistance".
A #Thread.
RETWEET for others to learn.🙂🔥
Firstly let's break things down to the smallest understandable level.
What does "Support" and "Resistance" mean in basic English terms or dictionary interpretation?
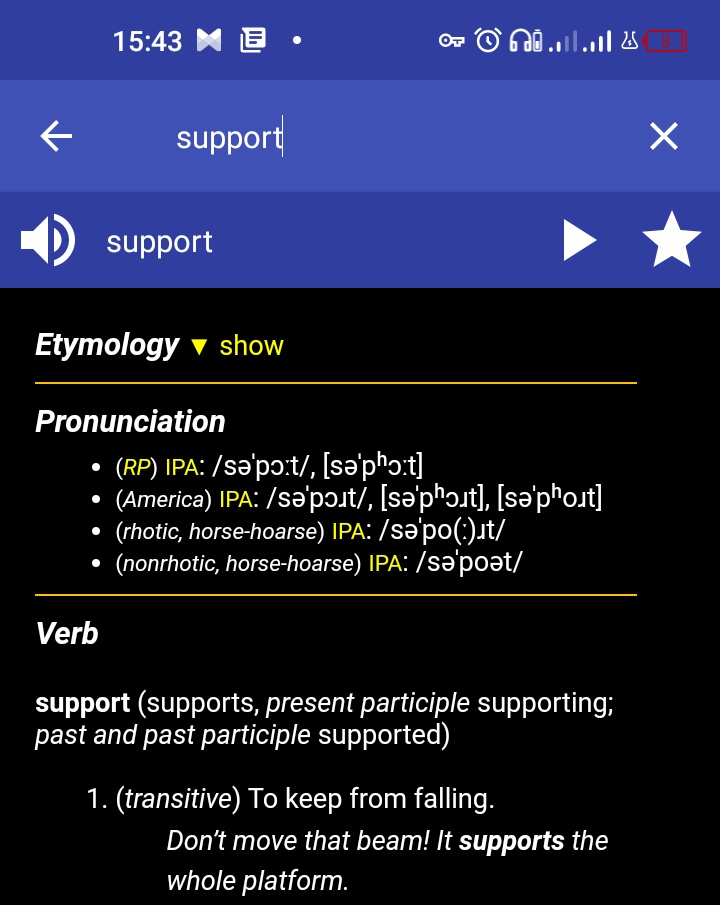
Support according to the dictionary means "to keep from falling" that is to sustain or establish.
What does "Support" and "Resistance" mean in basic English terms or dictionary interpretation?
Support according to the dictionary means "to keep from falling" that is to sustain or establish.
And also what does "Resistance" mean in basic terms?
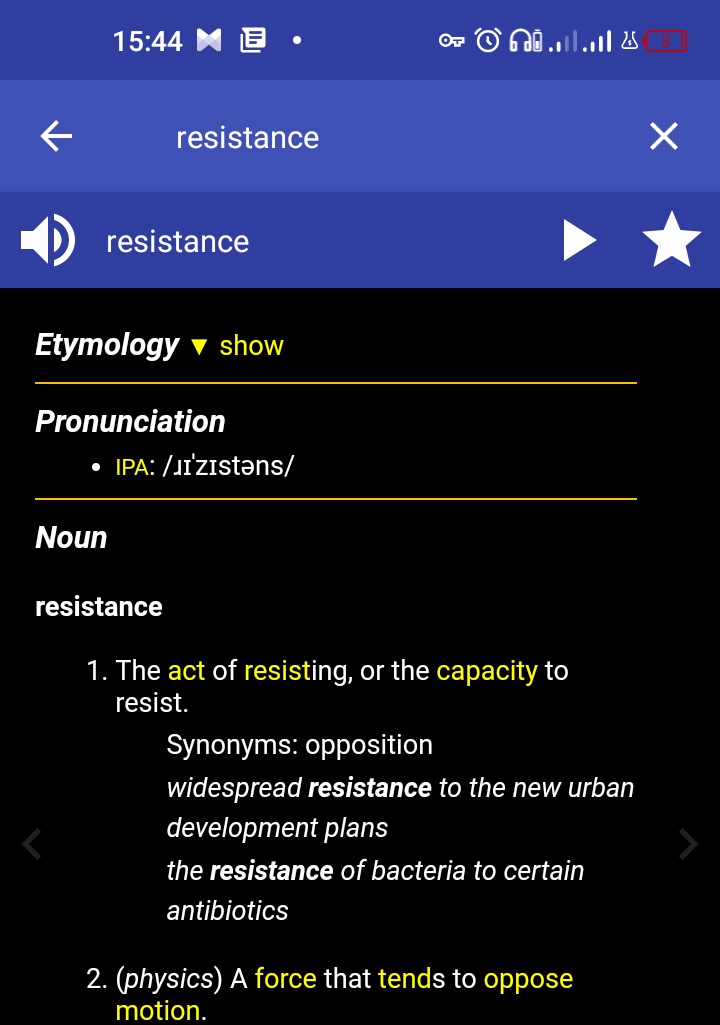
Resistance according to the dictionary means the "act of resisting or the capacity to resist" which also means a "force that tends to oppose motion".
That is a force that fights back an incoming movement.
Resistance according to the dictionary means the "act of resisting or the capacity to resist" which also means a "force that tends to oppose motion".
That is a force that fights back an incoming movement.
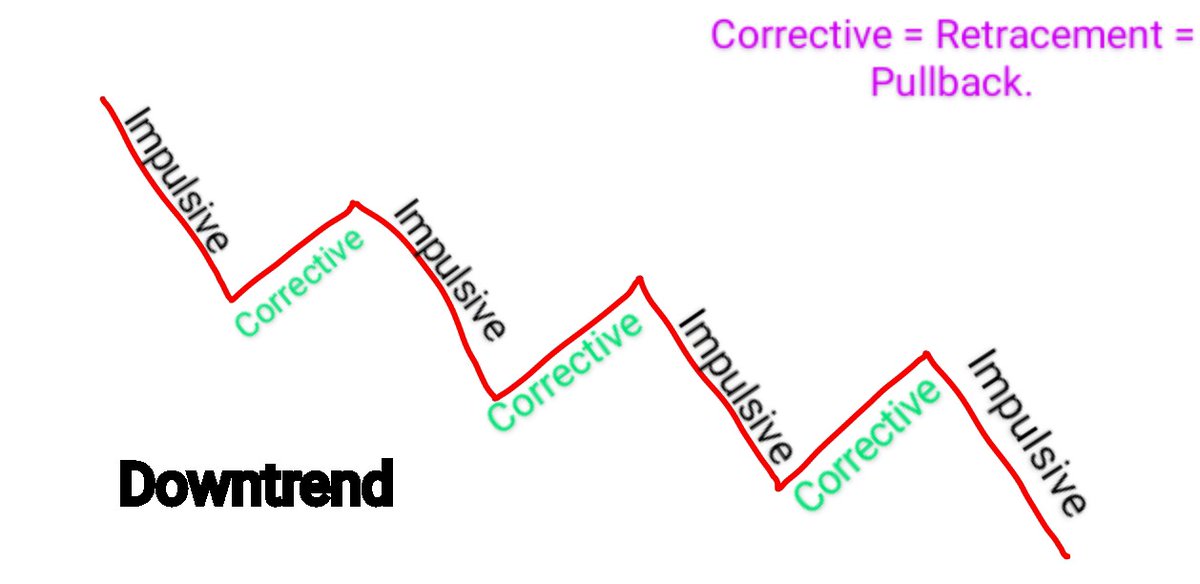
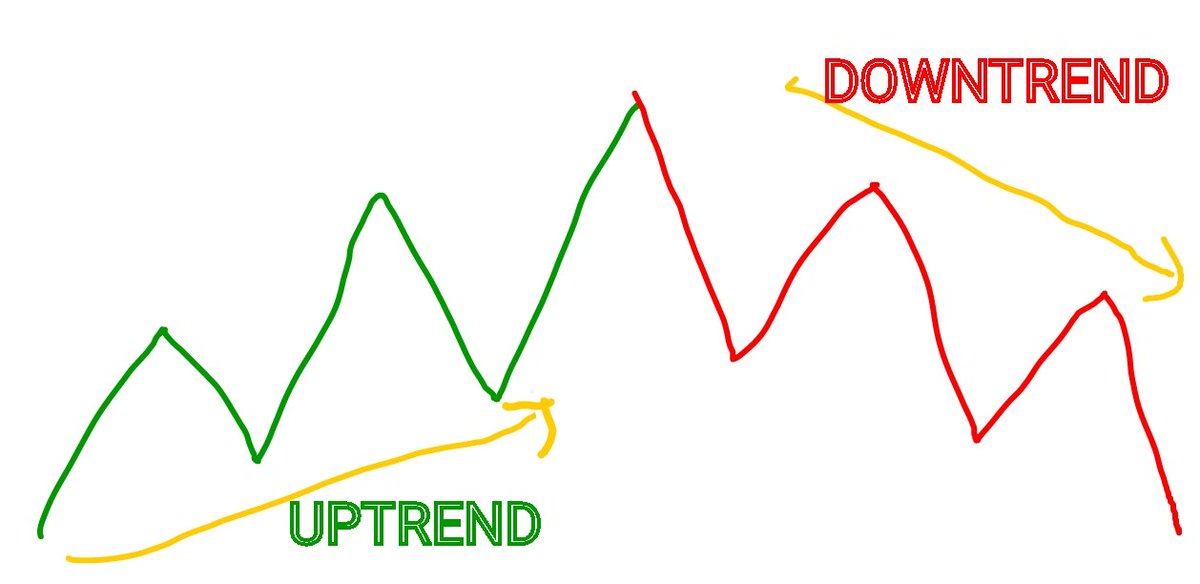
Remember I previously explained in the previous threads how Market structure works and how price doesn't just go up extensively always but makes dips before making further impulsive moves in an Uptrend and vice versa in a downtrend.
And I also explained consolidation or ranges.
And I also explained consolidation or ranges.

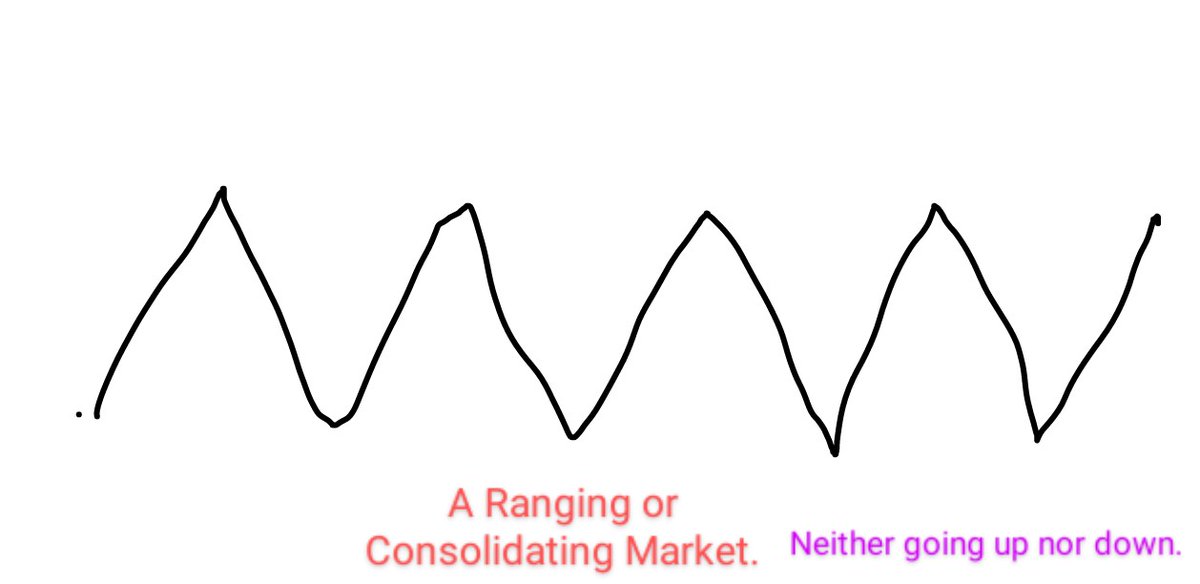
Now let's get to how this concept applies.
To understand it easily, see "Support" as the ground or floor level where price finds it difficult or fails to break after multiple attempts and see "Resistance" as the ceiling or roof level where price finds it difficult to break too.
To understand it easily, see "Support" as the ground or floor level where price finds it difficult or fails to break after multiple attempts and see "Resistance" as the ceiling or roof level where price finds it difficult to break too.
For instance if you bounce a ball hard in your room, the floor would act as the "support" level for the ball to bounce up & high while the ceiling would "Resist" or oppose that upward move by driving back the ball downwards.
Ball = Price.
Floor = Support.
Ceiling = Resistance.
Ball = Price.
Floor = Support.
Ceiling = Resistance.
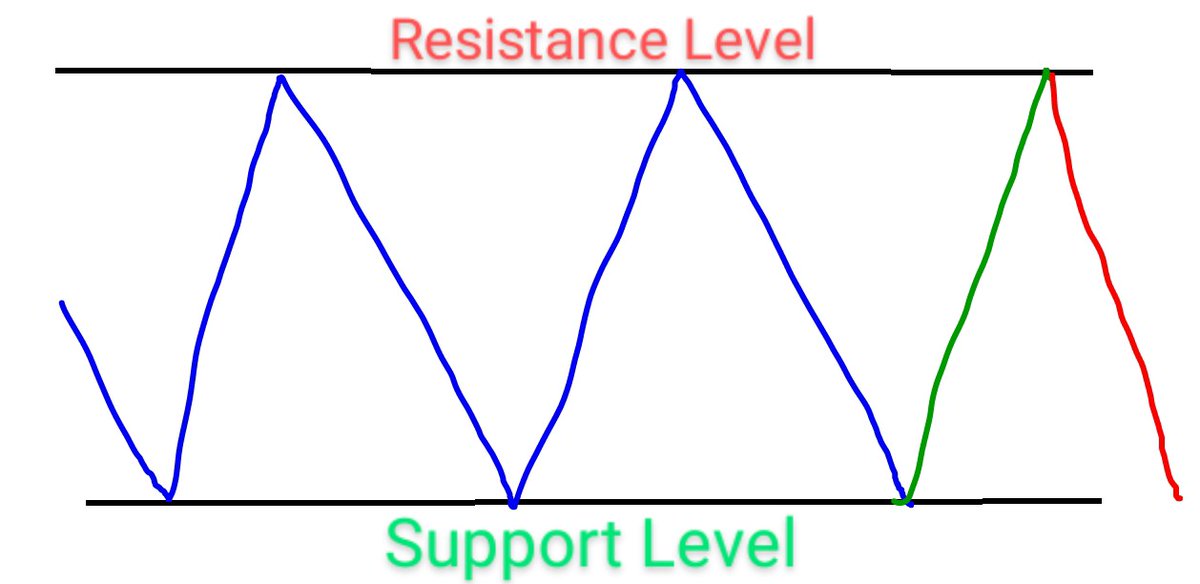
There'll always be a level where price makes multiple bounces which can be seen on the charts.
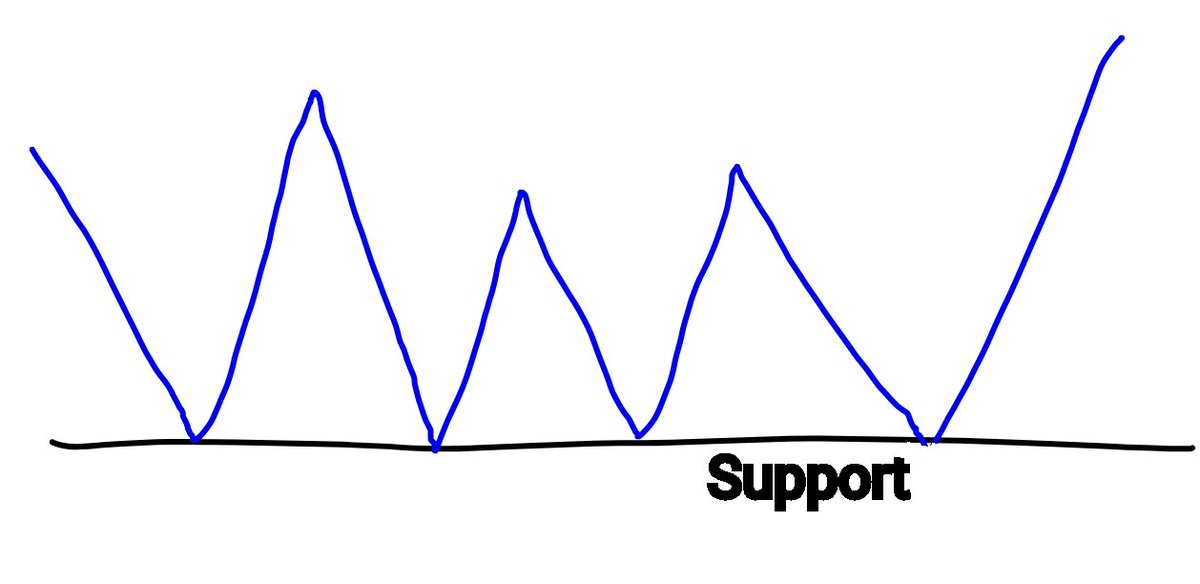
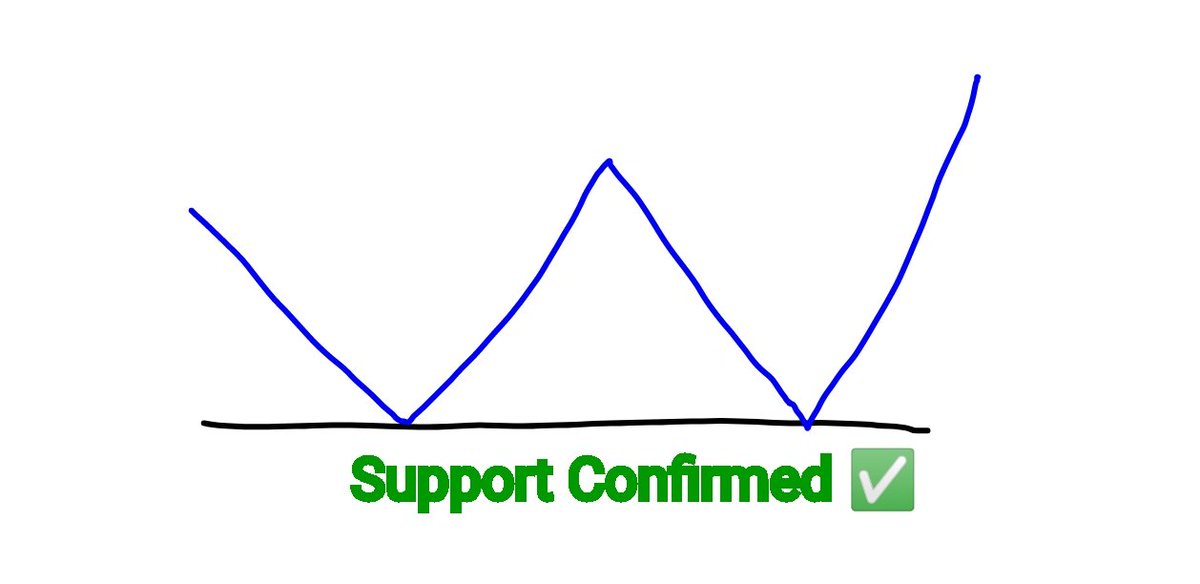
See the illustration of a "Support" in this picture.
Why's it called a Support?
It's because price "fails to break below" that line/area and made "multiple bounces" (4) from it.
See the illustration of a "Support" in this picture.
Why's it called a Support?
It's because price "fails to break below" that line/area and made "multiple bounces" (4) from it.
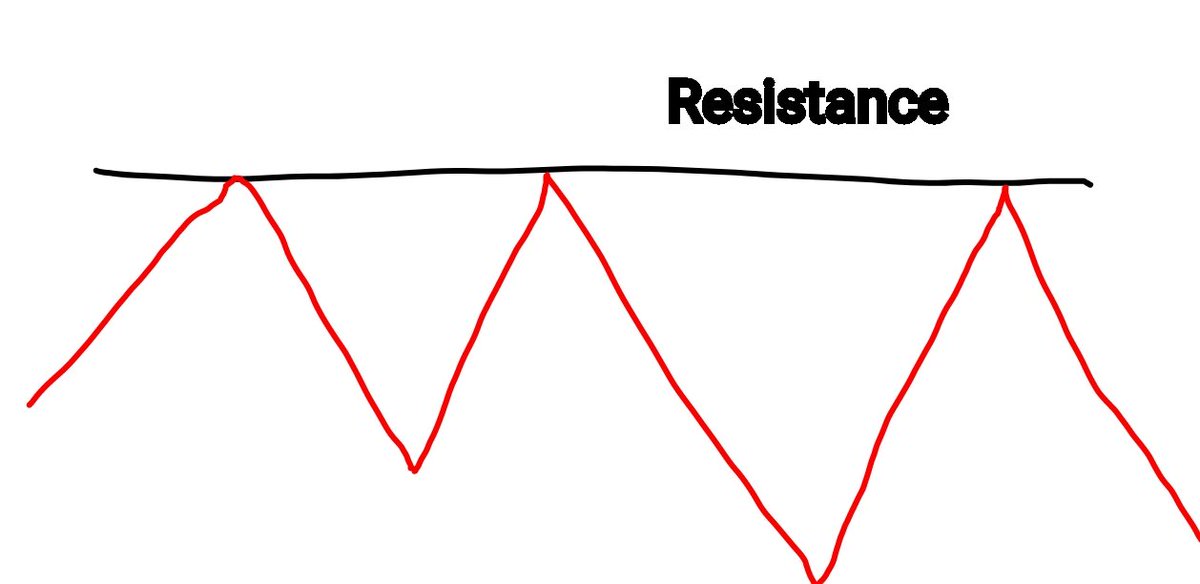
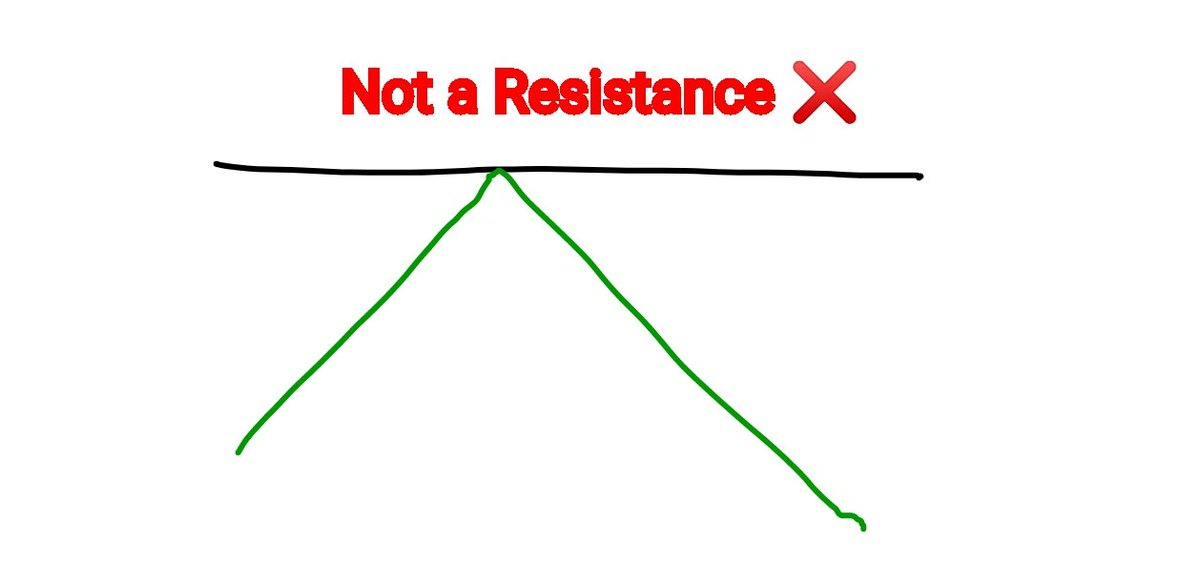
And here's an illustration of a "Resistance".
And why's it also called a Resistance?
It's simply because price has "failed to break above or go higher" that line/area, hence that line is called a Resistance because it has "opposed the upward movement of price" several times(3)
And why's it also called a Resistance?
It's simply because price has "failed to break above or go higher" that line/area, hence that line is called a Resistance because it has "opposed the upward movement of price" several times(3)
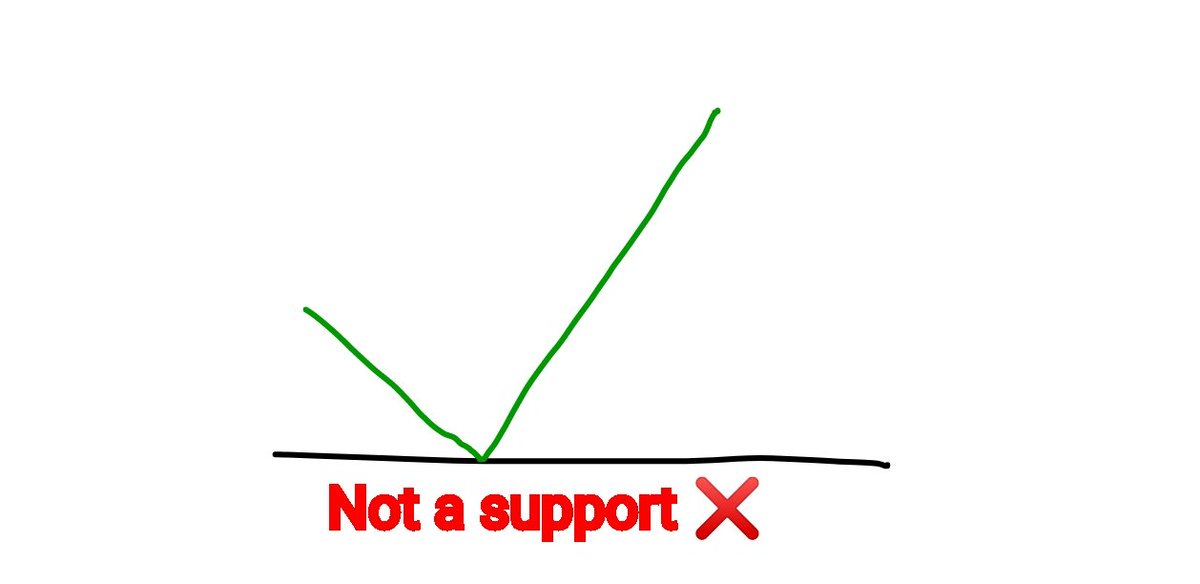
Note that for a support or resistance level to be confirmed, price needs to have tested that area "at least twice".
If price hasn't touched a level at least twice, you can't call it any level yet.
See the illustrations below to understand what I mean.
If price hasn't touched a level at least twice, you can't call it any level yet.
See the illustrations below to understand what I mean.

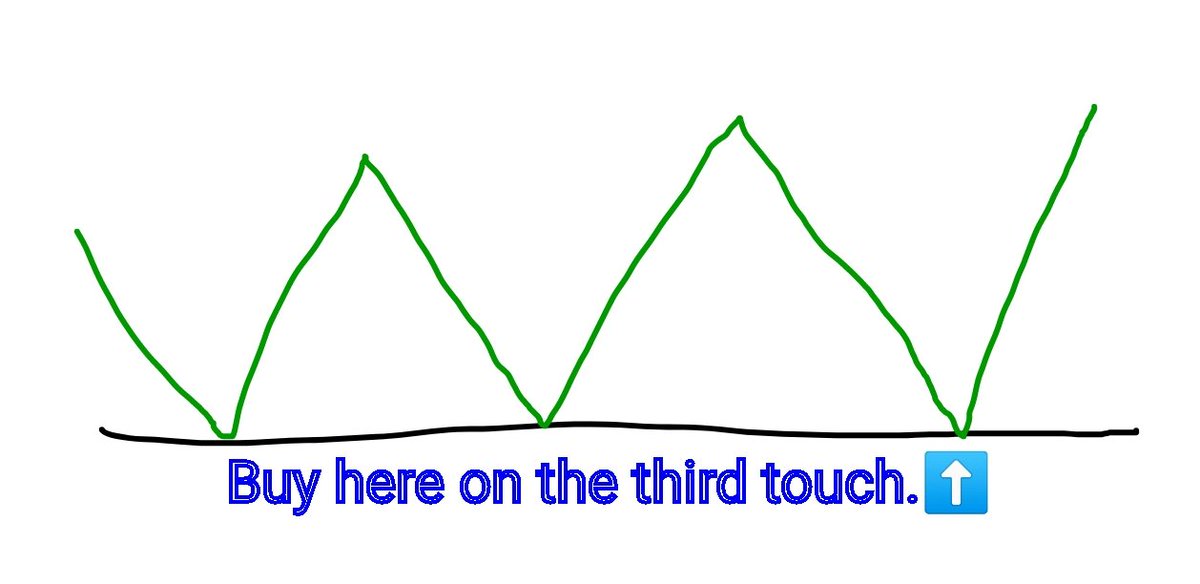
Now here's how you trade "Support and Resistance"
You know in a support scenario you expect price to touch that support level and go up again right? So what do you do?
You buy when price touches the support line or when price gets close to it.
A Support level is where you BUY.
You know in a support scenario you expect price to touch that support level and go up again right? So what do you do?
You buy when price touches the support line or when price gets close to it.
A Support level is where you BUY.

And if you missed the third touch, you can wait for the fourth touch to buy.
Remember you're not buying until the support level is confirmed which is after at least two touches. So if you missed the first buy which is the third touch, you'll wait for the fourth touch to buy.
Remember you're not buying until the support level is confirmed which is after at least two touches. So if you missed the first buy which is the third touch, you'll wait for the fourth touch to buy.

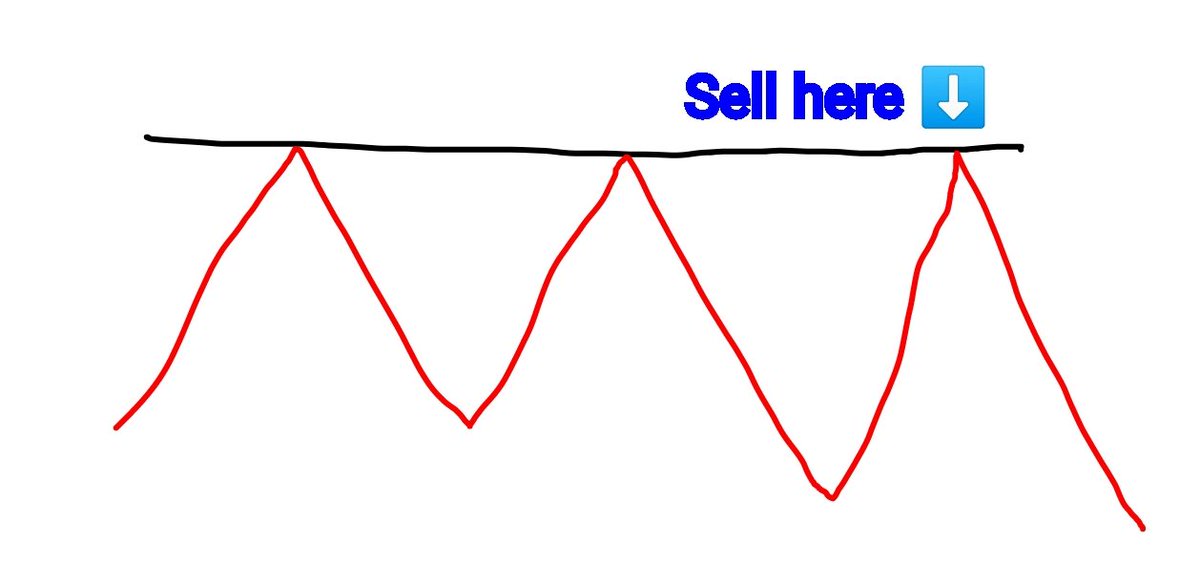
And let's move to "Resistance".
This also has the same method of confirmation. That is you only confirm a Resistance after at least two failed attempts for price to break higher, hence you expect price to reach that level and fall again.
A Resistance level is where you SELL.
This also has the same method of confirmation. That is you only confirm a Resistance after at least two failed attempts for price to break higher, hence you expect price to reach that level and fall again.
A Resistance level is where you SELL.

Now let me widen the view and give you a large range.
You can see we're currently in an area or range where we have a support and resistance.. Now how do you trade in this scenario based on what I taught you above?
Simple.
Buy at the Support level, and Sell at the Resistance.
You can see we're currently in an area or range where we have a support and resistance.. Now how do you trade in this scenario based on what I taught you above?
Simple.
Buy at the Support level, and Sell at the Resistance.


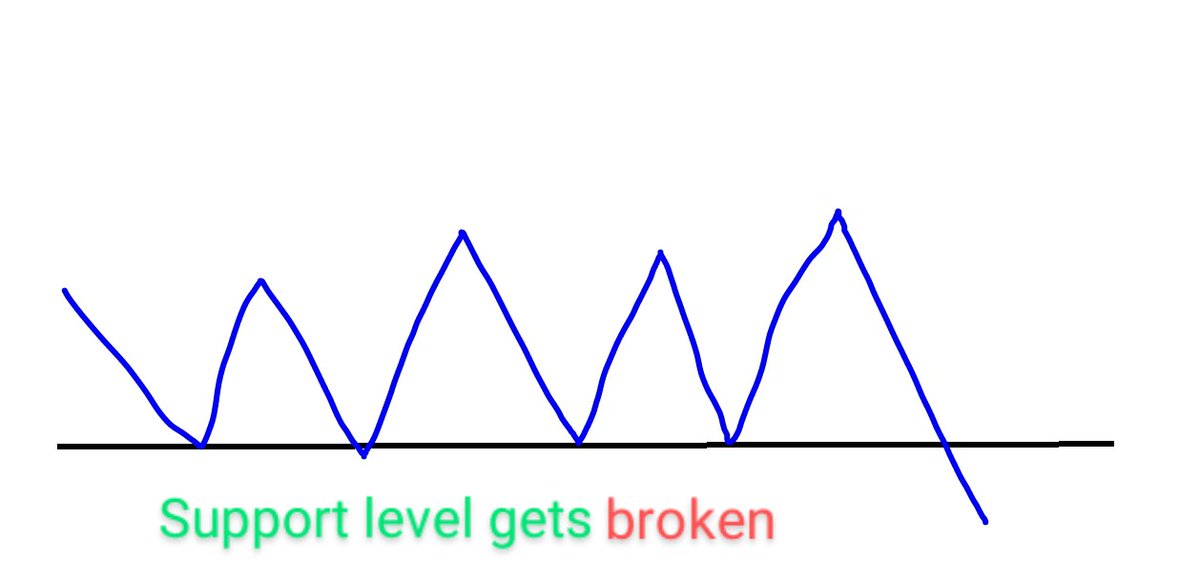
One important thing you need to note is that the more a level is tested, the weaker it'll get. This doesn't mean it won't work, it may and it may not. But if a level (be it support or resistance) gets tested 4, 5 or more times, it'll get weaker and would be more likely to break.
Let me explain using an illustration.
You can see in the first frame that the support zone was tested 4 times before it gave way by price breaking below it.
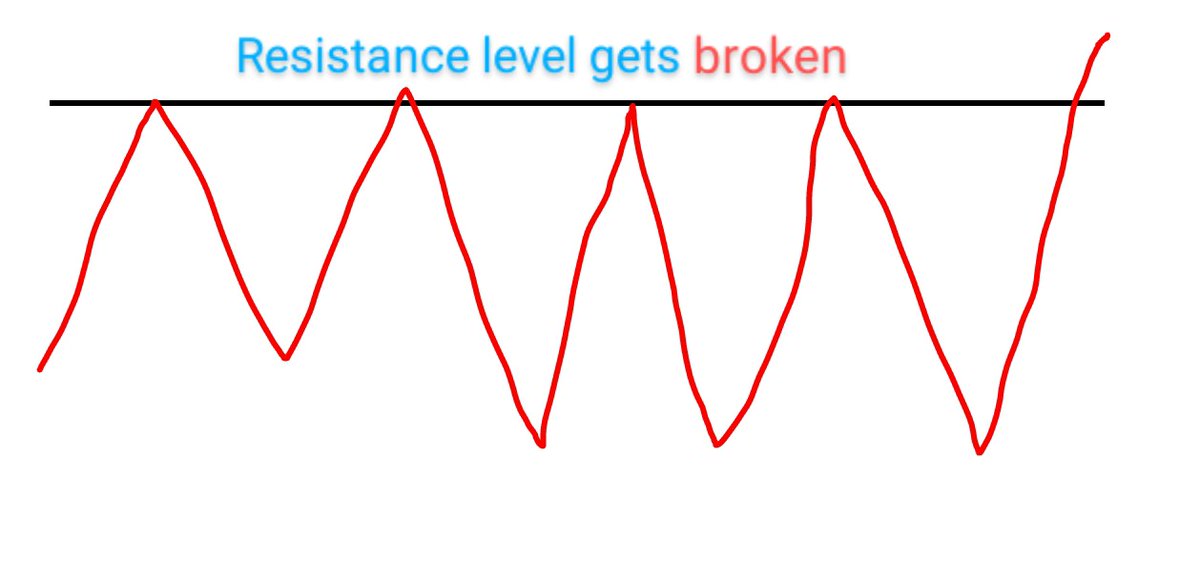
And you can also see in the second frame how the resistance level got violated by price breaking above it after 4 tests.
You can see in the first frame that the support zone was tested 4 times before it gave way by price breaking below it.
And you can also see in the second frame how the resistance level got violated by price breaking above it after 4 tests.
So what happens next after price breaks those zones?
Once those zones are broken, they are now invalidated and you can't place trades using them again, but here's a twist.
Sometimes we can have a flip in these levels, that is a support zone that was once a difficult area for...
Once those zones are broken, they are now invalidated and you can't place trades using them again, but here's a twist.
Sometimes we can have a flip in these levels, that is a support zone that was once a difficult area for...
price to break below can now become a level where price would find resistance & vice versa.
I'll illustrate for easier understanding.
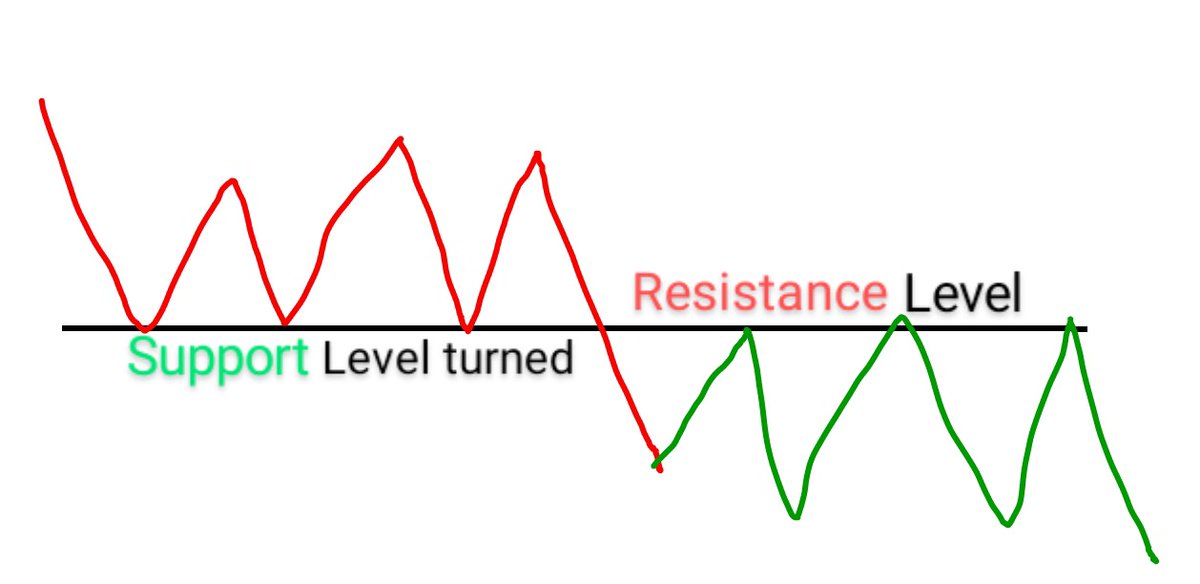
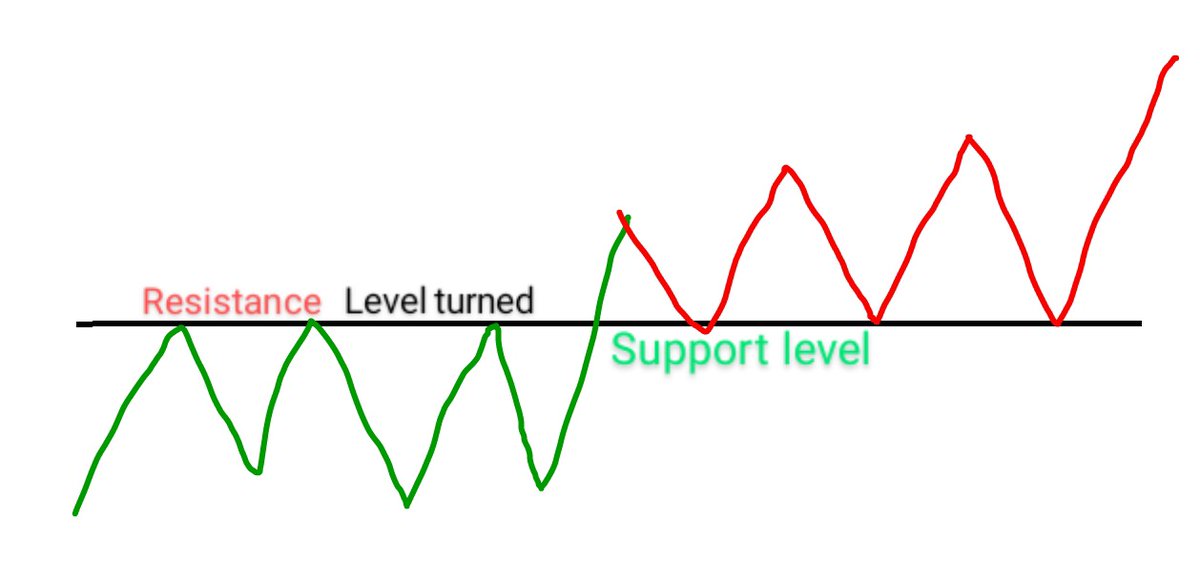
You can see in Frame 1 that we had a support level which was broken and later became a Resistance.
You can also see the vice versa in Frame 2.
I'll illustrate for easier understanding.
You can see in Frame 1 that we had a support level which was broken and later became a Resistance.
You can also see the vice versa in Frame 2.
This shows trading is all about probabilities and you can't be too sure or 100% guaranteed on any price action, which is why you need to always apply risk management in your trades and use a stop loss to prevent heavy losses if there's one.
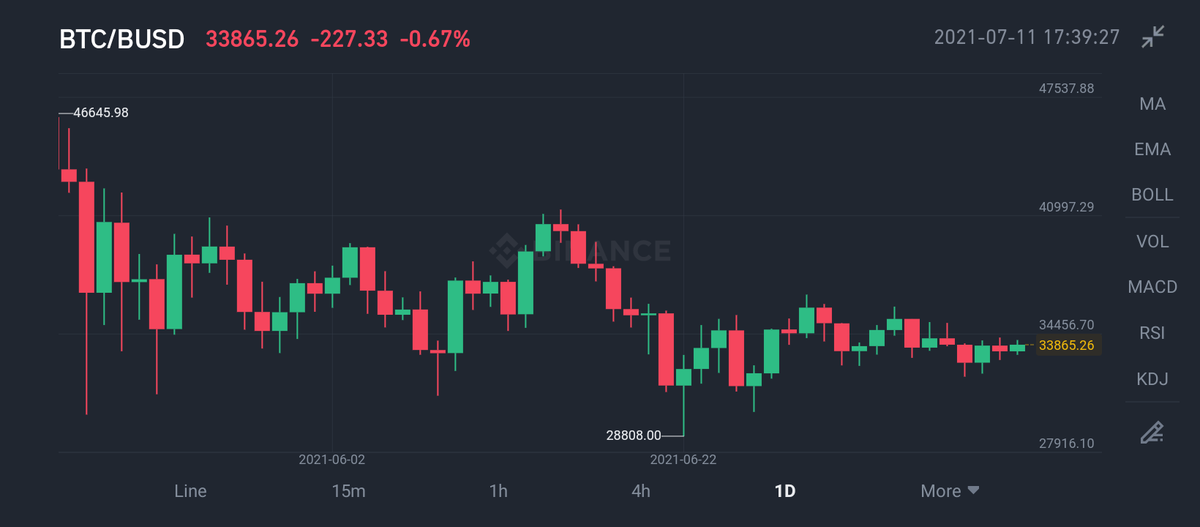
Now let's go practical using Binance.
Now let's go practical using Binance.
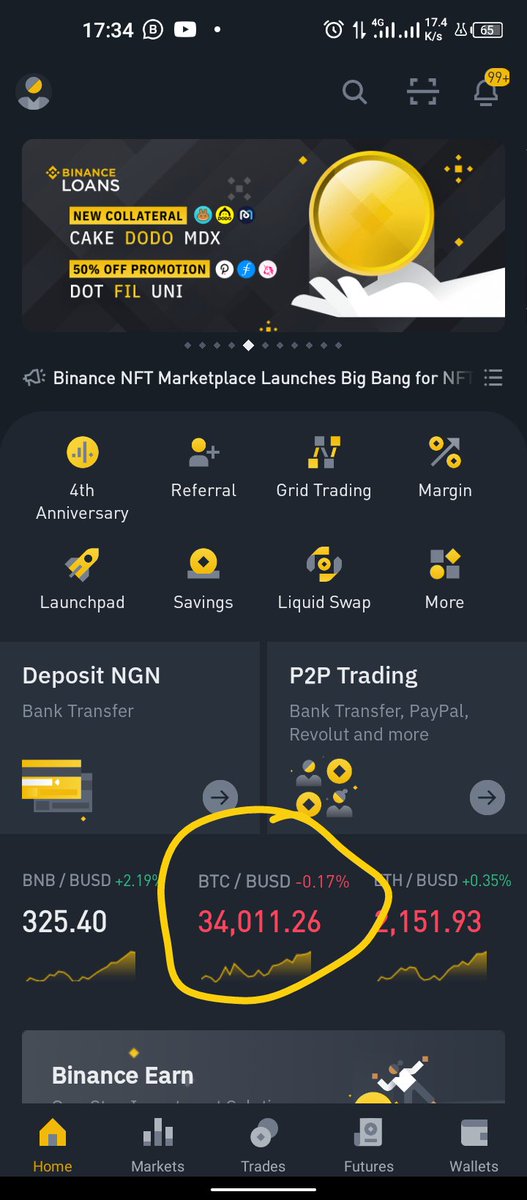
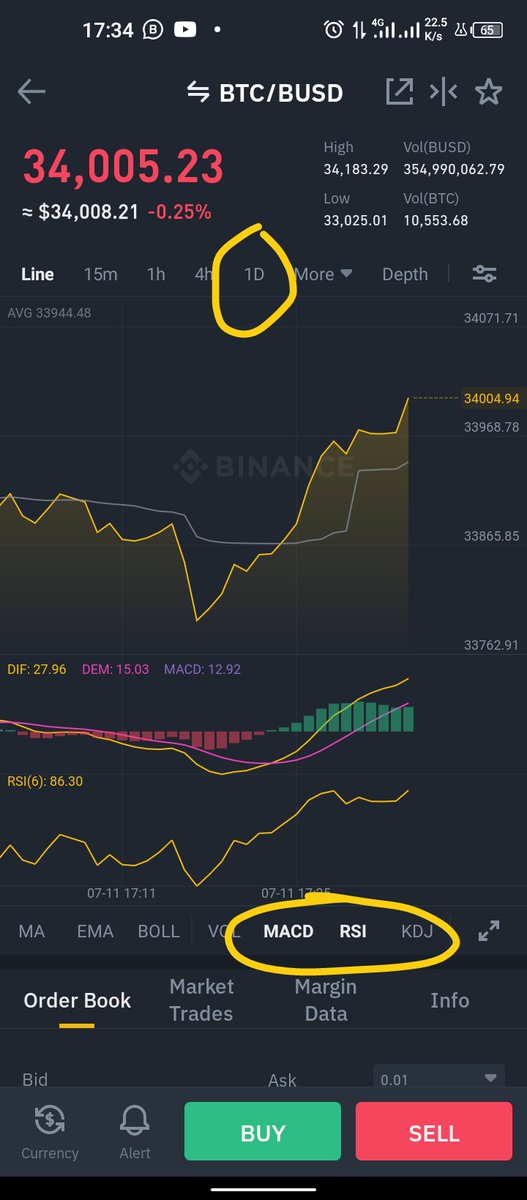
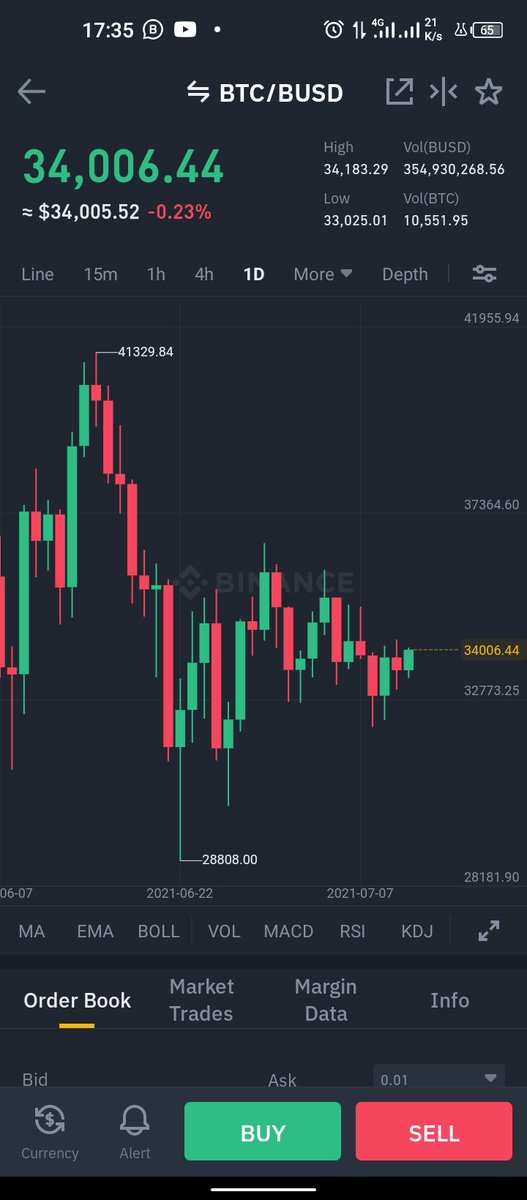
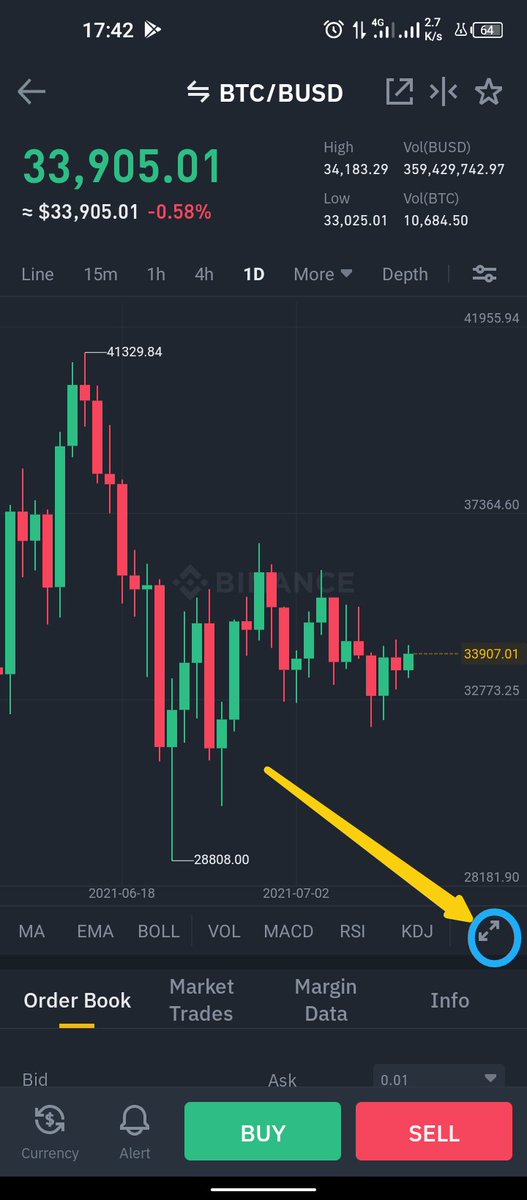
Analyzing with your phone in portrait mode won't be comfortable so you'd need to have it in landscape mode for a wider view of the chart, that is you'll have to rotate your phone.
Change your chart interface to landscape mode by clicking the extension icon at the bottom right.
Change your chart interface to landscape mode by clicking the extension icon at the bottom right.
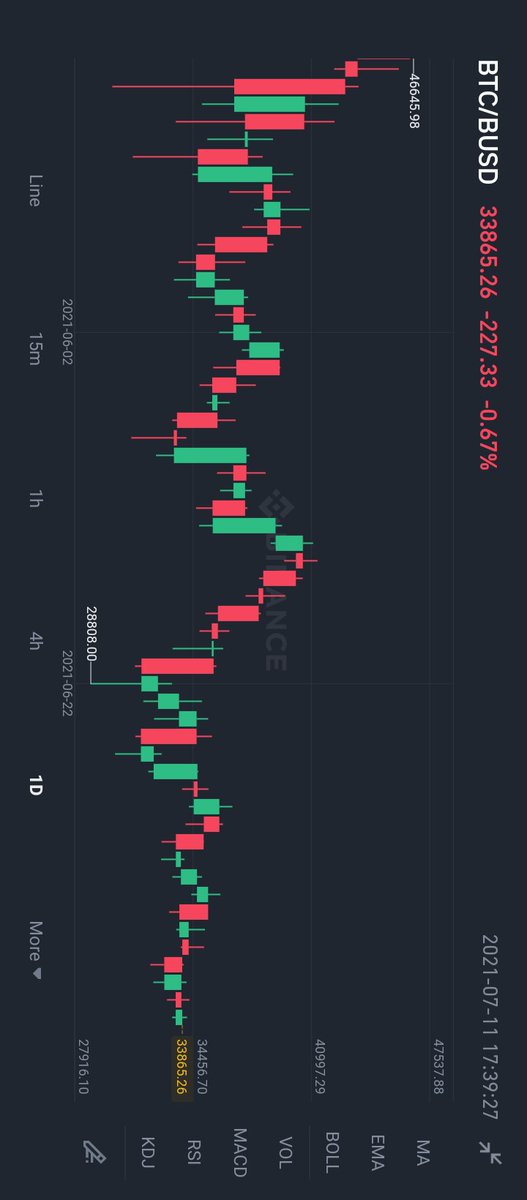
Now with our current view, let's find the support and resistance zones on this chart.
Remember we're looking for something like Frame 1.
So I'll want you to zoom your chart to a level that's good enough for you to see this just like in Frame 2.
Remember we're looking for something like Frame 1.
So I'll want you to zoom your chart to a level that's good enough for you to see this just like in Frame 2.

Now another thing you need to know is that chart examples and illustrations given in textbooks are mostly theoretical are different from live ones you practically see, and this is a problem a lot of traders face, they get accustomed to studying concepts and patterns on materials
but fail to identify those concepts and patterns on a live chart... And this is something I don't want you to face which is why I always ensure we go practical after every theoretical teaching I give.
The concept of support and resistance I taught you and just used illustrations
The concept of support and resistance I taught you and just used illustrations
for may look simple with the drawings I made, but it's a different thing on the chart.
Now check the illustration I made and the live chart, you may not know it's the same concept I illustrated on the drawing (left) that's also shown in the live chart (right) unless I tell you.
Now check the illustration I made and the live chart, you may not know it's the same concept I illustrated on the drawing (left) that's also shown in the live chart (right) unless I tell you.

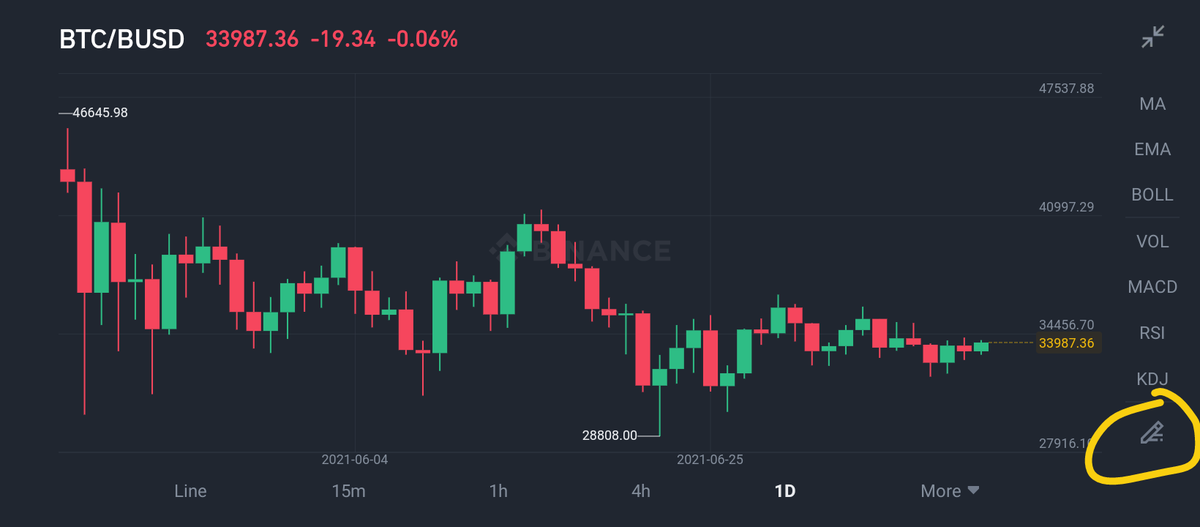
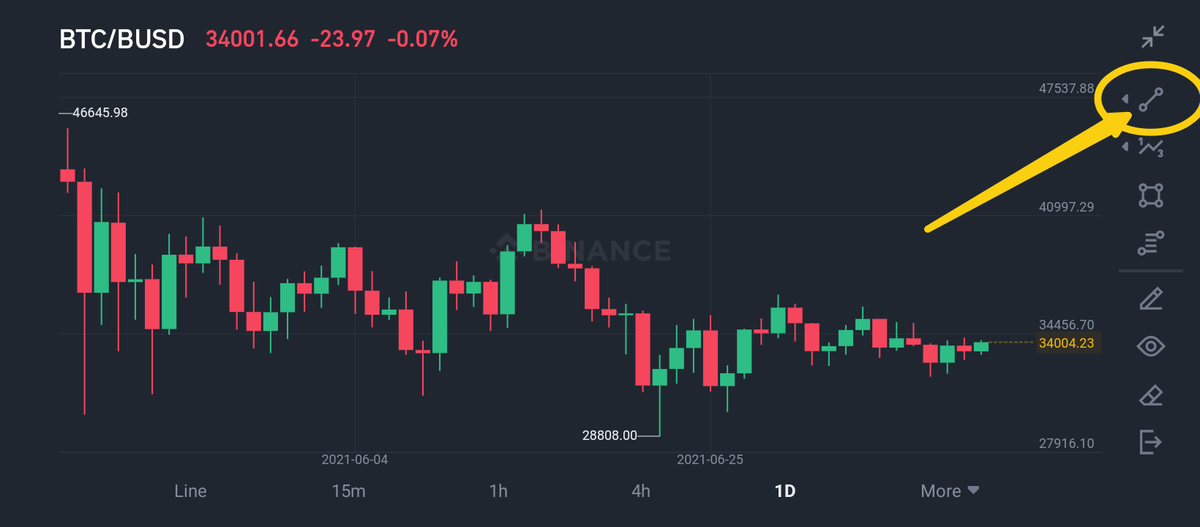
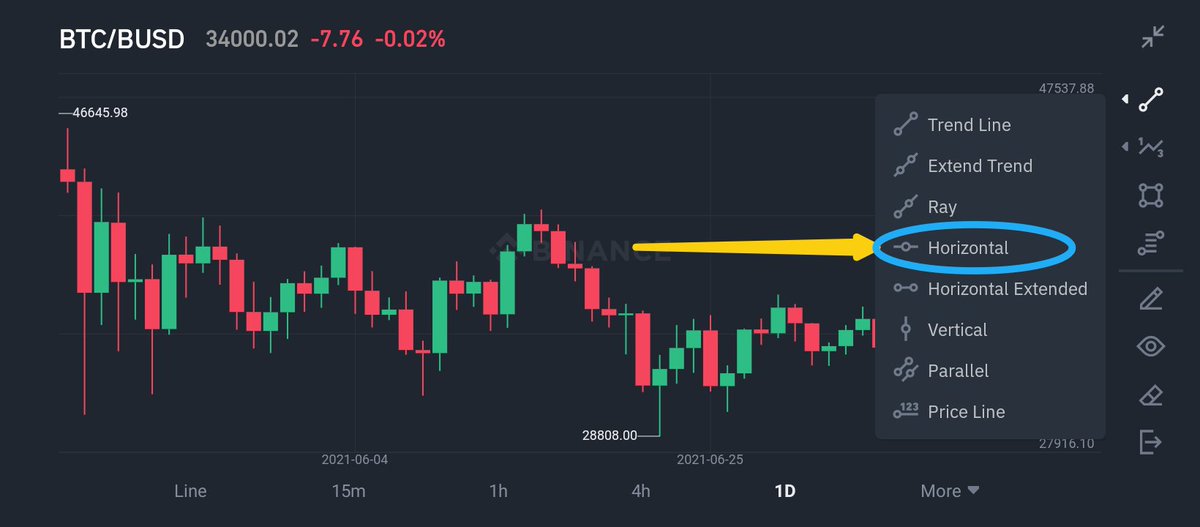
Now let's get to it.
Follow the steps in the images below.
Ensure your Binance Application is Up to date so you can use these technical tools.
I'll post a video below this showing you how to place the horizontal line at the support and resistant levels of this chart.
Follow the steps in the images below.
Ensure your Binance Application is Up to date so you can use these technical tools.
I'll post a video below this showing you how to place the horizontal line at the support and resistant levels of this chart.
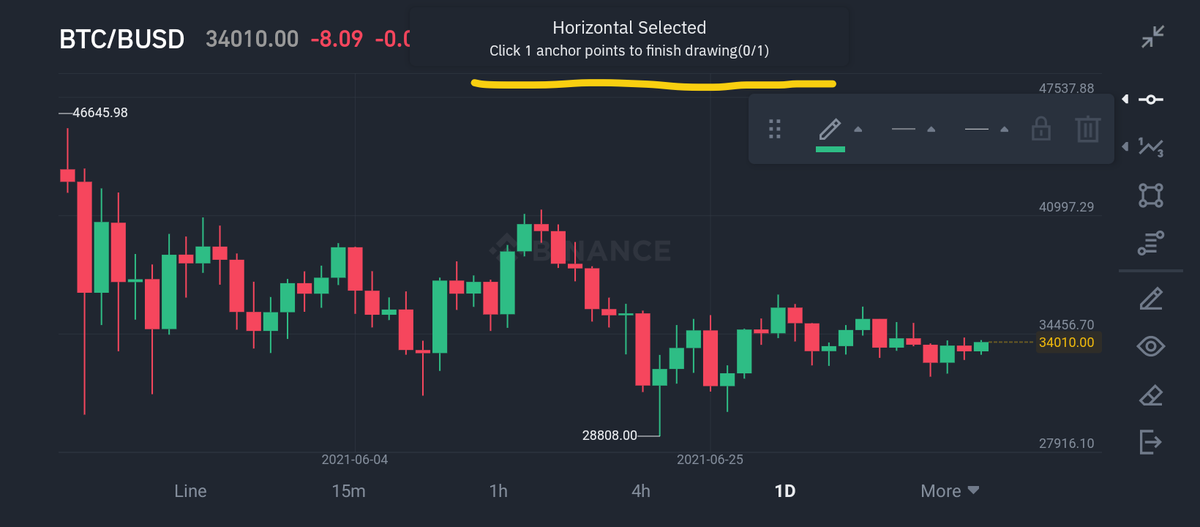
Watch this video to see how to place horizontal lines at the support and resistance levels.

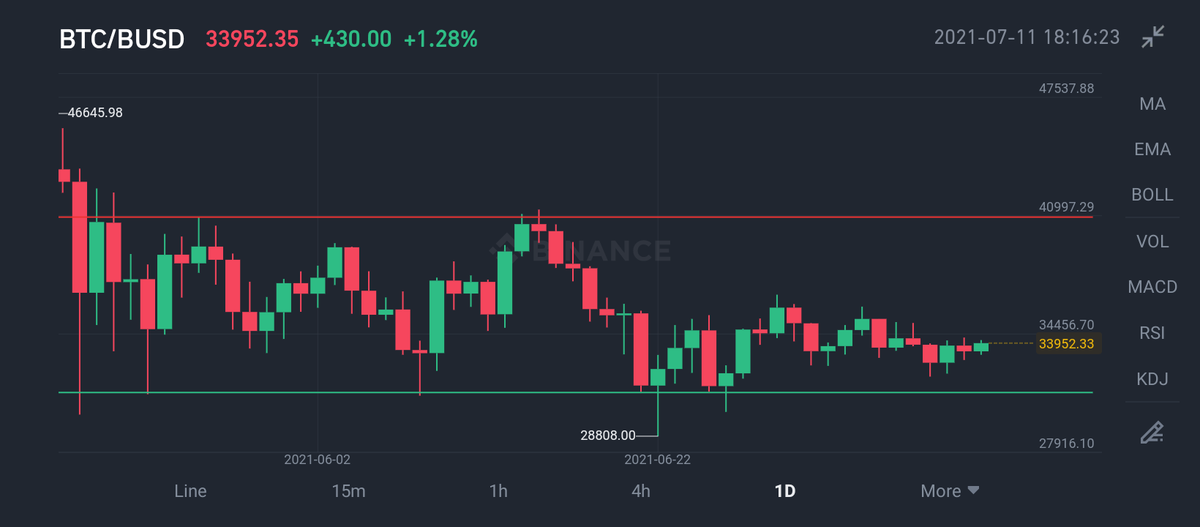
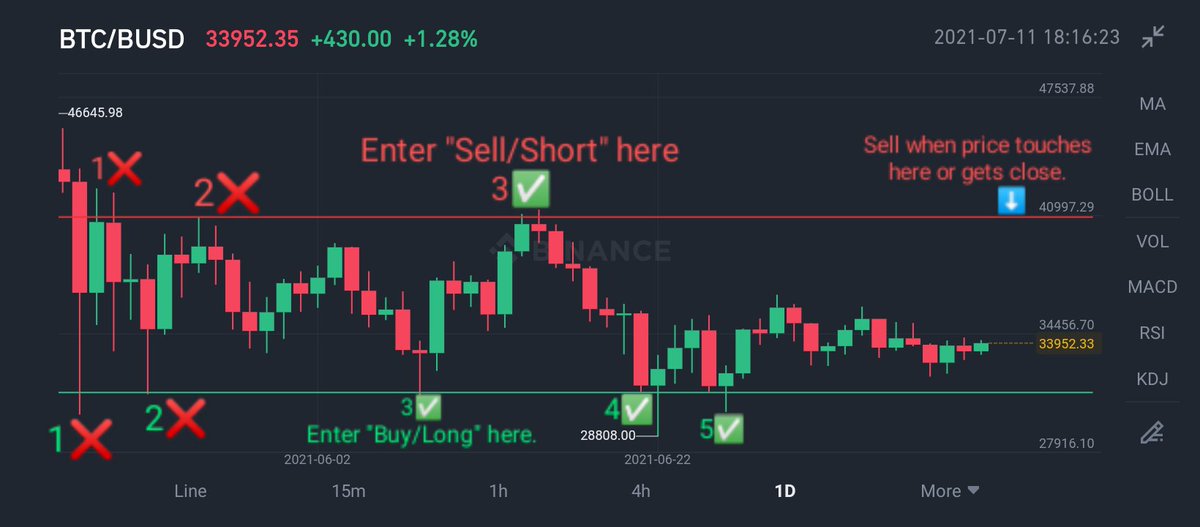
Here's how your chart should look like after drawing the support and resistance levels.
You can see we have several touches on those levels and I've also shown how you're to identify these levels and take trades based on them.
You can see we have several touches on those levels and I've also shown how you're to identify these levels and take trades based on them.
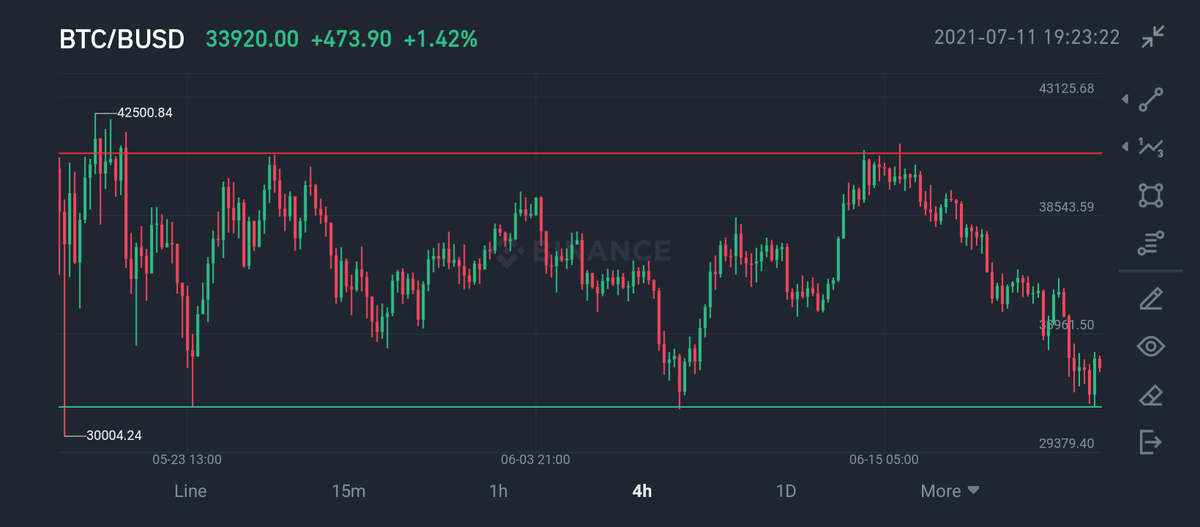
Let's go to a lower timeframe to find more S and R setups.
Click on the 4Hour timeframe, you'll see a choppy movement inside the lines we drew.
But there's a better illustrative setup on the 1Hour timeframe. (3rd of July) with an instance of a Resistance level turned Support.
Click on the 4Hour timeframe, you'll see a choppy movement inside the lines we drew.
But there's a better illustrative setup on the 1Hour timeframe. (3rd of July) with an instance of a Resistance level turned Support.

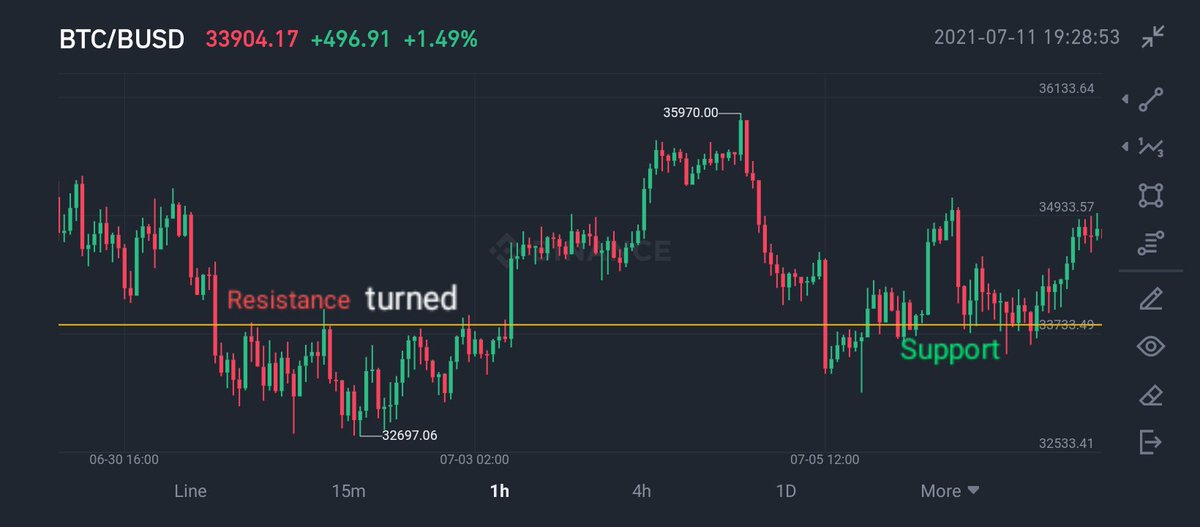
You can also use the rectangle tool to draw the support and resistance zones so it covers the extended areas of the levels just as shown in the video below.
I identified another resistance zone which you can also see in the video.
I identified another resistance zone which you can also see in the video.

So with this I hope you now understand how to make trade entries & exits using the Support and Resistance concept.
What I'm giving you as your assignment is to pick several trading pairs of your choice and identify their Support & Resistance levels.
Do so on several timeframes.
What I'm giving you as your assignment is to pick several trading pairs of your choice and identify their Support & Resistance levels.
Do so on several timeframes.
In the next chapter I'll be teaching you the Trendline concept and how to place trades using trendlines.
Follow my account and turn on post notifications to receive it on time when it drops.
I remain your favorite Cryptocurrency Coach @ThePaulOla.
More trade success.🙂♥️📊
Follow my account and turn on post notifications to receive it on time when it drops.
I remain your favorite Cryptocurrency Coach @ThePaulOla.
More trade success.🙂♥️📊
If you have any questions, you can ask below, I'll reply you.
And also I'll appreciate a RETWEET on this thread so others can benefit too.
Here's the beginning of the thread if you want to retweet.
And also I'll appreciate a RETWEET on this thread so others can benefit too.
Here's the beginning of the thread if you want to retweet.
Here's the PART 2 of this Series.
You can join my Telegram channel for more Cryptocurrency updates and teachings.🙂
t.me
t.me
Just saw I made a mistake to the attachment of the second part, I dropped the second part to DeFi (Fundamental Analysis) instead of technical analysis
Here's the second part.
Here's the second part.
Here's PART 4 - Trendline Trading Strategy.
جاري تحميل الاقتراحات...